Fig. 4.
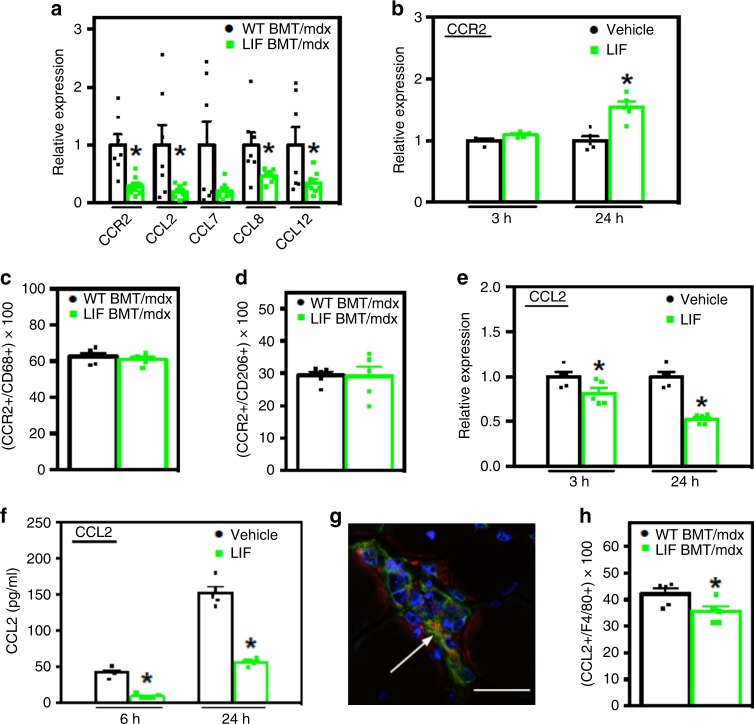
Transplantation of CD11b/LIF transgenic BMCs disrupts Ccl2 expression in dystrophic muscles by inhibiting macrophage expression of CCL2. a QPCR analysis shows that TA muscles from LIF BMT/mdx recipients have reduced expression of Ccr2 and its ligands Ccl2, Ccl7 (P = 0.06), Ccl8, and Ccl12. N = 7 or 8 for WT BMT/mdx and LIF BMT/mdx data sets, respectively, except n = 7 for LIF BMT/mdx Ccl8 data set. * Indicates significantly different from WT BMT/mdx recipients at P < 0.05. F-test Ccr2 (P = 0.0087), Ccl2 (P < 0.0001), Ccl7 (P = 0.0001), Ccl8 (P = 0.001), and Ccl12 (P = 0.001). For all histograms in the figure, the bars indicate mean ± sem. b QPCR analysis for Ccr2 gene expression of BMDMs treated with recombinant LIF (10 ng/ml) for 3- and 24-h. c, d Muscle sections co-labeled with antibodies to CD68 (c) or CD206 (d) and CCR2 show no change in the proportions of cells co-expressing CCR2 between transplant recipient groups. N = 5 for each data set. e QPCR analysis shows reduced Ccl2 gene expression in BMDMs stimulated with LIF as described in (b). f ELISA of conditioned media showed less CCL2 secreted into the media of BMDMs stimulated with LIF for 6- and 24-h compared to control cultures. For cell culture experiments, N = 5 technical replicates for each data set, cells for each time point were isolated from independent donors. Significant findings were verified with biological replicates of experiments from independent donors. P-values based on two-tailed t-test. F-test CCL2 protein 24 h (P = 0.0337). g, h Cross-sections of TA muscles from WT BMT/mdx or LIF BMT/mdx mice were immunolabeled with antibodies to F4/80 (green) and CCL2 (red) show that F4/80+ cells express CCL2 (g). Nuclei are stained blue with DAPI. Bar = 10 μm. h The proportion of F4/80+ cells co-expressing CCL2 was reduced in LIF BMT/mdx recipients. N = 5 for each data set, * indicates significantly different from WT BMT/mdx recipients at P < 0.05. P-values based on two-tailed t-test. Source data are provided as a Source Data file

