Fig. 7.
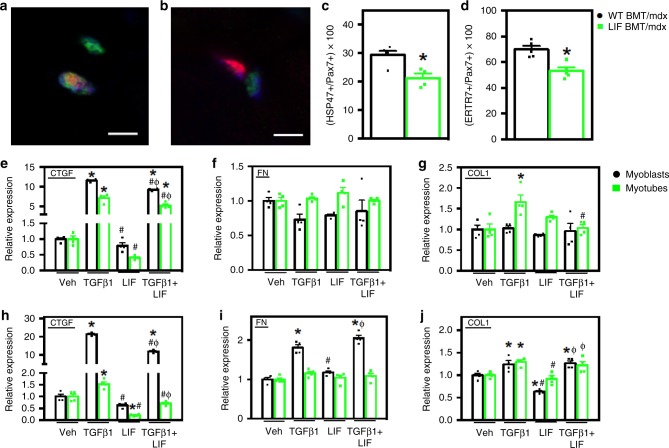
LIF inhibits fibrogenesis and TGFβ1-induced Ctgf expression in muscle cells. a TA muscle sections were co-labeled with antibodies to Pax7 (red) and HSP47 (green) in WT BMT/mdx (a) and LIF BMT/mdx (b) recipients. Nuclei appear blue (DAPI). Bars = 5 μm. c Fewer Pax7+ cells co-expressed HSP47 in LIF BMT/mdx recipients (green symbols) compared to WT BMT/mdx recipients (black symbols). d Muscle sections were also co-labeled with antibodies to Pax7 and fibrogenic marker Ertr7 to confirm that fewer Pax7+ cell acquired a fibrogenic phenotype in LIF BMT/mdx recipients. N = 5 for each data set, except n = 4 for WT BMT/mdx Pax7/HSP47 data set, * indicates significantly different from WT BMT/mdx at P < 0.05. P-values based on two-tailed t-test. For all histograms in the figure, the bars indicate mean ± sem. e–j Myoblasts (black symbols) and myotubes (green symbols) were stimulated with LIF (10 ng/ml) and TGFβ1 (10 ng/ml) for 3- (e–g) or 24-h (h–j). e, h LIF inhibited TGFβ1-induced Ctgf mRNA in myoblasts and myotubes after 3- and 24-h of stimulation. LIF inhibited basal Ctgf expression in myotubes at 24 h (h). f, i LIF did not affect Fn1 expression in myoblasts or myotubes after 3- or 24-h. Additionally, LIF attenuated TGFβ1-induced Col1a1 expression in myotubes, but not myoblasts after 3 h of stimulation (g). Myoblasts stimulated with LIF for 24 h had reduced Col1a1 expression (j). N = 4 technical replicates per group. Significant findings were verified with biological replicates of experiments from independent cultures. * Indicates significantly different from control, # indicates significantly different from TGFβ1-stimulated, and Φ indicates significantly different from LIF-stimulated at P < 0.05. P-values based on ANOVA with Tukey’s multiple comparison test. Source data are provided as a Source Data file

