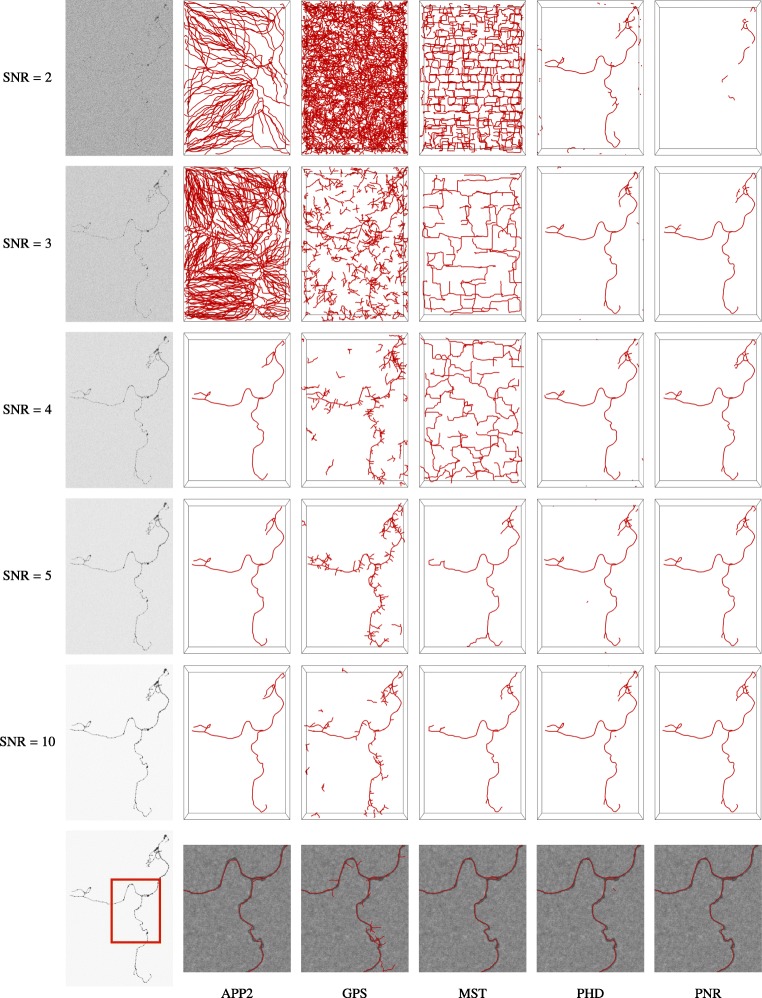
Fig. 12.
Visual comparison of neuron reconstructions produced by the considered methods from synthetic image stacks of a single neuron at different SNR levels. The image stacks (generated used COR = 0) are shown as inverted maximum intensity projections (left column) and the reconstructions of the different methods (remaining columns) are shown in red as surface renderings

