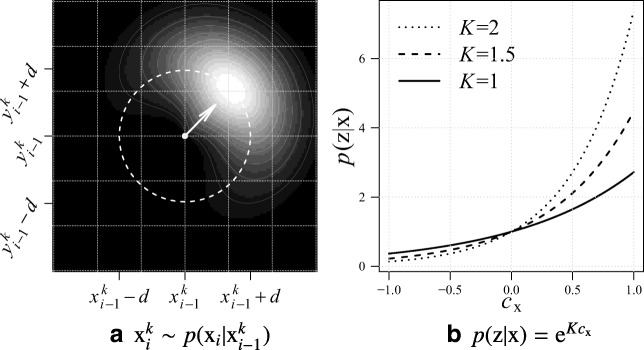
Fig. 2.
Functions used in the prediction and update steps of the SMC filtering: a the prediction importance sampling distribution (for ease of visualization a 2D example is given) and b the measurement likelihood function for different values of K. Reprinted with permission from Radojević and Meijering (2017b)

