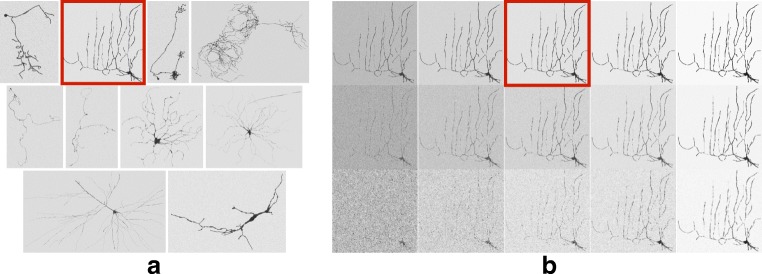
Fig. 5.
Illustration of the synthetic neuron data set used in the presented experiments. a Example images of the 10 selected neurons simulated at SNR = 4 and COR = 0.0. b Different simulations of the neuron indicated by the red outline in (a) for SNR = 2, 3, 4, 5, and 10 (from left to right) and COR = 0.0, 1.0, and 2.0 (from top to bottom). The marked image in (b) is the same as the marked image in (a). All examples shown here are maximum intensity projections of the 3D synthetic images with inverted intensities for better visualization

