Fig. 1.
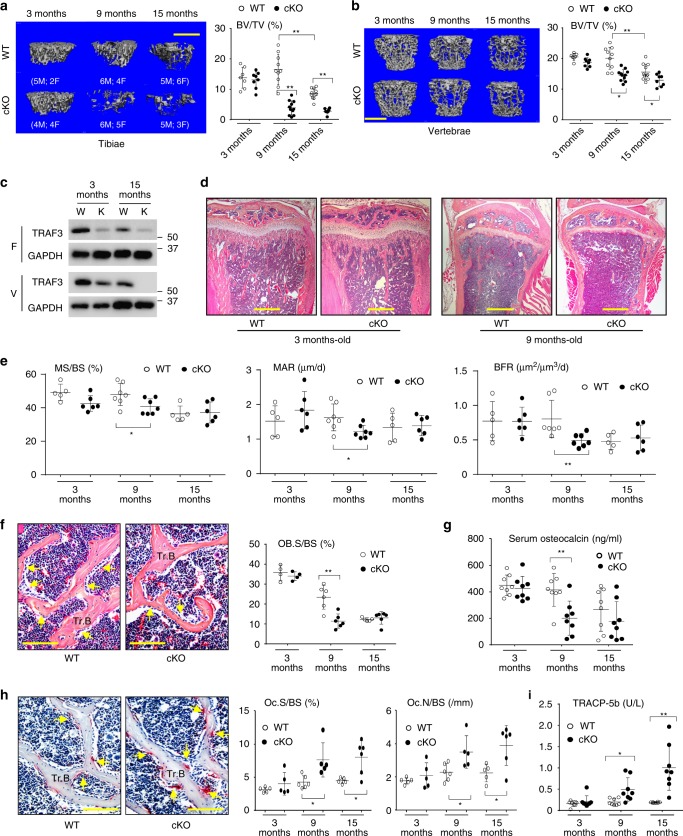
TRAF3 cKO mice have early onset osteoporosis. a, b Representative µCT images and bone volume (BV/TV) values in a tibiae and b L1 vertebrae from litters of 3-, 9-, and 15-month (m)-old WT and TRAF3 conditional knockout (cKO) mice, including both males and females, as listed in the figure. Mean ± SD (3-m-old WT (n = 7) and cKO (n = 8), 9-m-old WT (n = 10) and cKO (n = 11), 15-m-old WT (n = 11) and cKO (n = 8) biologically independent mice; *p < 0.05, **p < 0.01). Scale bar, 1 mm. c Western blot (WB) of TRAF3/GAPDH in lysates of femoral metaphyses (F; upper panel) and vertebrae (V; lower panel) from 3- and 15-m-old WT and cKO mice. d Representative H&E-stained sections of proximal tibiae of 3- and 9-m-old WT and TRAF3 cKO mice. Scale bar, 400 μm. e Mineralizing surface (MS/BS), mineral apposition rate (MAR), and bone formation rate (BFR) analyzed in calcein double-labeled plastic sections of L1 vertebrae from the mice in (a). Mean ± SD (3-m-old WT (n = 5) and cKO (n = 6), 9-m-old WT (n = 7) and cKO (n = 7), 15-m-old WT (n = 5) and cKO (n = 6) biologically independent samples; *p < 0.05, **p < 0.01). f Representative H&E-stained images of vertebral sections from 9-m-old WT and cKO mice showing osteoblasts (yellow arrows) on the trabecular bone (Tr.B) surfaces, and histomorphometric analysis of osteoblast surfaces (OB.S/BS) from the mice in (a). Mean ± SD (3-m group: n = 4, other groups: n = 6 biologically independent samples; **p < 0.01). Scale bar, 100 μm. g Serum osteocalcin values tested by ELISA from the 3-, 9-, and 15-m-old WT and cKO mice in (a). Mean ± SD (n = 8 biologically independent samples; **p < 0.01). h Representative images of TRAP-stained vertebral sections from 9-m-old WT and cKO mice, and histomorphometric analysis of osteoclast numbers (Oc.N) and surfaces (Oc.S) from the mice in (a). Mean ± SD (3-m group: n = 5, other groups: n = 6 biologically independent samples; *p < 0.05). Scale bar, 100 μm. i Serum TRACP-5b levels tested by ELISA from the mice in (a). Mean ± SD (n = 8 biologically independent samples; *p < 0.05, **p < 0.01). All analyses done using one-way ANOVA with Tukey’s post-hoc test

