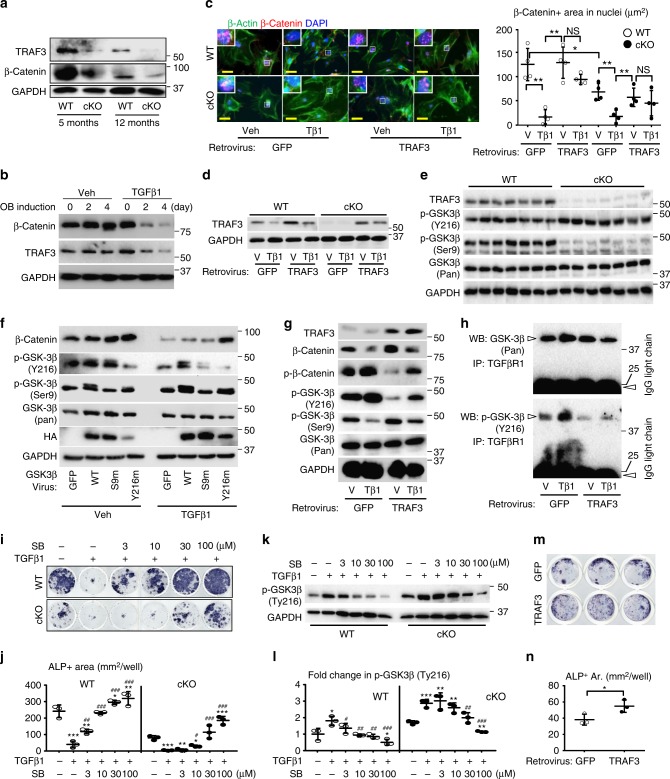
Fig. 4.
Reduction in TRAF3 activates GSK-3β to impair β-catenin signaling. a WB of TRAF3 and β-catenin in long bones. b WB of TRAF3, β-catenin, and GAPDH in WT BdMPCs induced for OB differentiation with vehicle or TGFβ1. c IF and quantification of nuclear β-catenin and β-actin (cytoskeleton) in WT and cKO calvarial pre-OBs treated with vehicle or TGFβ1 for 48 h following pMX-GFP control or pMX-TRAF3 retrovirus infection. Mean ± SD (n = 4 biologically independent samples; *p < 0.05, **p < 0.01). Scale bar, 20 μm. d WB of TRAF3 and GAPDH in cells as in (c). e WB of TRAF3, phospho-GSK-3β (Tyr216/Ser9), and total GSK-3β in cortical bones from 12-m-old WT and TRAF3 cKO mice. f WB of β-catenin, phospho-GSK-3β (Ser9/Tyr216), total GSK-3β, HA, and GAPDH in WT calvarial pre-OBs treated with vehicle or TGFβ1 for 48 h following lentivirus infection with GFP, or HA-tagged WT-, Ser9-mutated (S9m) or Tyr216-mutated (Y216m) GSK-3β. g Protein levels of TRAF3, phospho-β-catenin, β-catenin, phospho-GSK-3β (Ser9/Tyr216), and total GSK-3β tested in WT calvarial pre-OBs treated with vehicle or TGFβ1 for 8 h following pMX-GFP or -TRAF3 retrovirus infection. h Cell lysates from (g) immunoprecipitated using anti-TGFβRI Ab followed by WB of GSK-3β and phospho-GSK-3β (Tyr216). i BdMPCs from 4-m-old WT and cKO mice treated with TGFβ1+/−GSK-3β inhibitor, SB-216763, for 7 days and stained for ALP activity. j Quantification of ALP+ cell areas. Mean ± SD (n = 3 biologically independent samples; *p < 0.05, **p < 0.01, ***p < 0.001 vs. vehicle; #p < 0.05; ##p < 0.01; ###p < 0.001 vs. TGFβ1 alone; one-way ANOVA with Tukey’s post-hoc test). k, l WB of phospho-GSK-3β (Tyr216) in WT and cKO BdMPCs treated with TGFβ1 plus SB-216763 (k), and densitometry analysis was performed (l). Mean ± SD (n = 3 biologically independent samples; *p < 0.05, **p < 0.01, ***p < 0.001 vs. vehicle; #p < 0.05; ##p < 0.01; ###p < 0.001 vs. TGFβ1 alone;). m pMX-GFP or -TRAF3 retrovirus-infected cells induced for OB differentiation for 5 days in 48-well plates and stained for ALP activity. n Quantification of ALP+ cell areas. Mean ± SD (n = 3 biologically independent samples; *p < 0.05; unpaired Student's t test). All other analyses done using one-way ANOVA with Tukey’s post-hoc test. All experiments were repeated twice with similar results. Tβ1: TGFβ1 (1 ng/ml)

