
Figure 6.
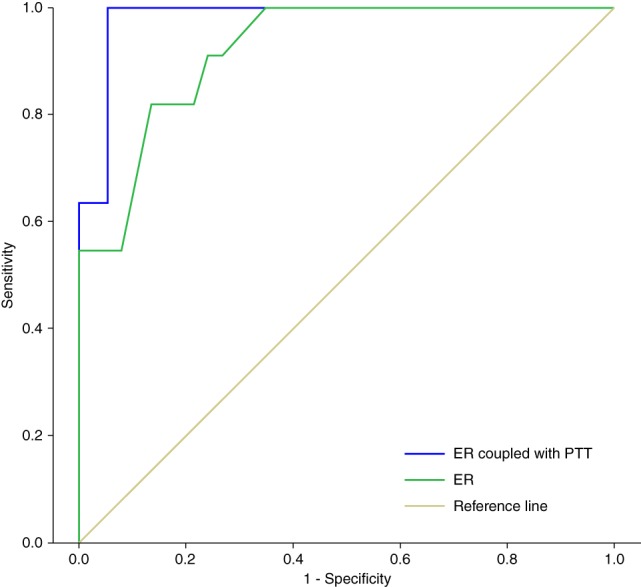
The ROC curve indicated that SSD of ER and SSD of ER coupled with PTT were significant predictors of positive LGDT. However, the AUC of the ROC curve of SSD of ER coupled with PTT was 0.980 ± 0.017 (P < 0.001), which was higher than for SSD of ER (0.921 ± 0.040, P < 0.001). AUC, area under the curve; ER, external rotation; LGDT, lateral gutter drive‐through; PTT, posterior tibial translation; ROC, receiver operating characteristic; SSD, side‐to‐side difference.