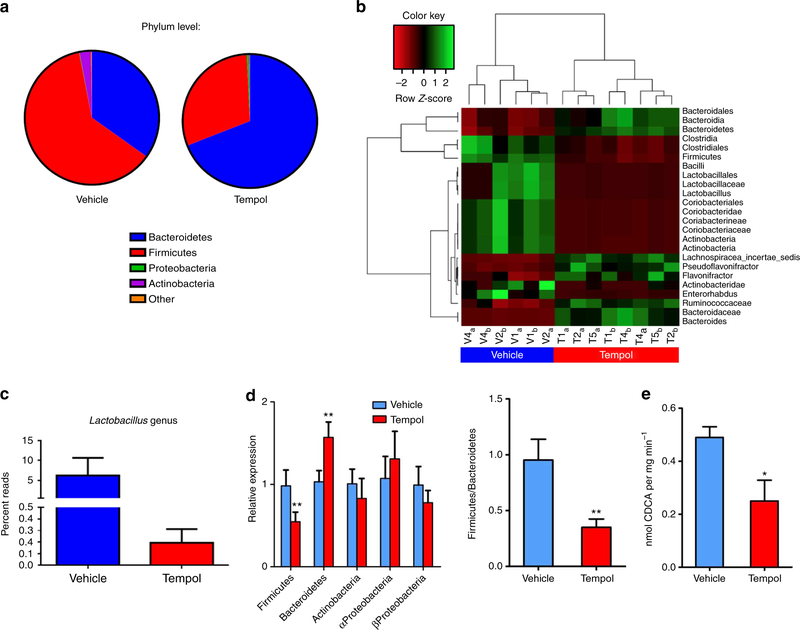
Figure 1 |. Tempol treatment induces gut micriobiome robust shifts.
(a) 16S rRNA gene sequencing analysis at the phylum levels of caecum content after 5 days of tempol treatment by gavage (250 mg kg−1). n = 3 per vehicle group, n = 4 per tempol group. (b) The heat map of 16S rRNA gene sequencing analysis of caecum content after 5 days of tempol treatment by gavage (250 mg kg−1). The scale: green colours indicate high values, whereas red colours indicate low values for the percent of reads that were classified at that rank. (c) 16S rRNA gene sequencing analysis of genus Lactobacillus caecum content after 5 days of tempol treatment by gavage (250 mg kg−1). n = 3 per vehicle group, n = 4 per tempol group. Data are presented as mean ± s.d. (d) qPCR analysis of phylum-level modifications from 16S rRNA of fecal microbiome after tempol treatment on a HFD for 12 weeks. n = 5 mice per group. Data are presented as mean ± s.d., ANOVA followed by two-tailed Student’s t-test. **P<0.01 compared with vehicle-treated mice. (e) Fecal BSH enzyme activity on vehicle- and tempol-treated mice on a HFD for 12 weeks. n = 5 mice per group. All data are presented as mean ± s.d., ANOVA followed by two-tailed Student’s t-test. *P<20.05, **P<0.01 compared with vehicle-treated mice.

