Figure 1.
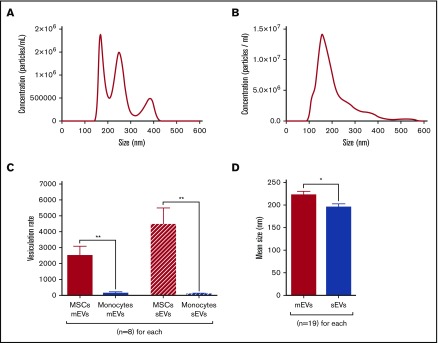
EV characterization by NTA. (A-D) mEVs and sEVs analyzed by NTA were isolated from the same CMML MSC culture SN by differential ultracentrifugation. *P ≤ .05, **P ≤ .005. (A) NTA profile of a sample of CMML MSC mEVs. (B) NTA profile of a sample of CMML MSC sEVs. (C) Vesiculation rates of MSCs and monocytes for mEVs and sEVs, defined as the number of vesicles shed per cell. MSCs are represented in red and monocytes in blue. (D) Mean size of MSC mEVs and sEVs (nm). MSC mEVs are represented in red and MSC sEVs in blue.

