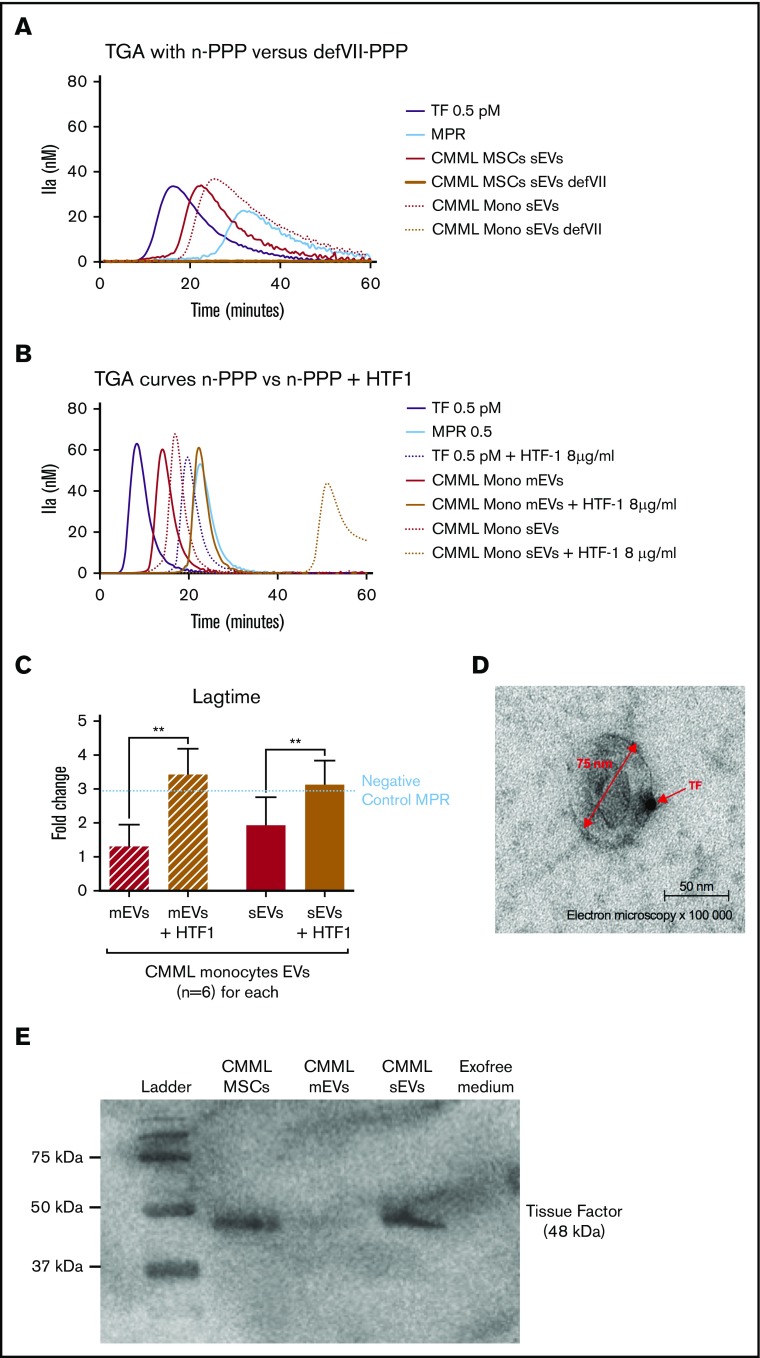
Figure 4.
The CMML MSCs and monocyte sEVs procoagulant effect is probably mediated by TF on EV membrane. Lag times are expressed as fold changes of the lag time obtained with the positive control (TF 0.5 pM). The negative control used was MPR 0.5. Any thrombin generated after corresponded to contact-phase activation. **P ≤ .005. (A) TGA curves of CMML MSCs and monocyte sEVs with n-PPP and FVII-deficient plasma (defVII-PPP). TGA conditions performed with normal plasma are represented in red, deficient FVII plasma in mustard, TF 0.5 pM in purple, and MPR in blue. Continuous curves represent MSC sEVs, and dotted curves represent monocyte sEVs. (B) TGA curves of CMML MSCs and monocyte sEVs with n-PPP and n-PPP with a blocking anti-TF antibody (HTF-1) at the concentration of 8 µg/mL. TGA conditions performed without HTF-1 are represented in red and with HTF-1 in mustard. TF 0.5 pM is represented in purple and MPR in blue. Continuous curves represent mEVs, and dotted curves represent sEVs. (C) Effect of a blocking anti-TF antibody (HTF-1, final concentration of 8 µg/mL) on coagulation lag time with n-PPP. TGA conditions performed without HTF-1 are represented in red and with HTF-1 in mustard. TF 0.5 pM is represented in purple. (D) Direct visualization of TF on sEV membranes with electron microscopy. Primary antibody, rabbit anti-TF; secondary antibody, gold-labeled anti-protein A rabbit. Observations were made using a transmission electron microscope (JEOL1200 EX) with a digital camera (VELETA), G = 100 000, at room temperature. (E) Western blot analysis of CMML MSCs and sEVs showing TF expression (48 kDa). CMML MSCs were used as positive control and Exofree medium as negative control.

