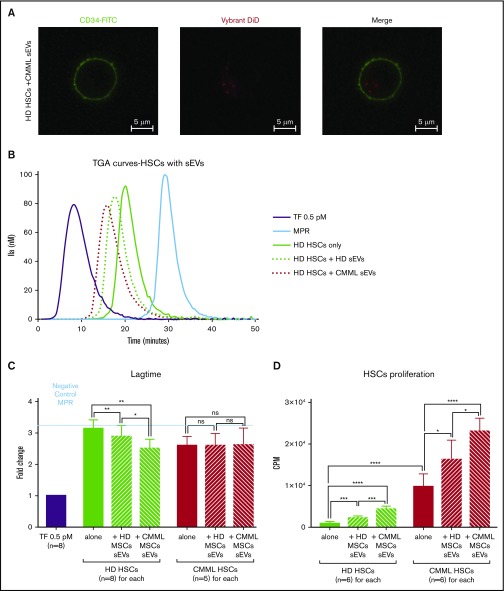
Figure 6.
MSC sEVs can interact with HSCs and increase their PCA. Lag times are expressed as fold changes of the lag time obtained with the positive control (TF 0.5 pM). The negative control used was MPR 0.5. Any thrombin generated after corresponds to contact-phase activation. *P ≤ .05, **P ≤ .005, ***P ≤ .0005, ****P ≤ .0001. (A) Visualization of CMML MSC sEV incorporation into HD HSCs by confocal microscopy. HSCs were CD34-FITC labeled, and sEVs were Vybrant DiD labeled; visualization was on a Zeiss Dynascope LSM710 NLO, 63×/1.4 oil-immersion objective, at room temperature. (B) TGA curves of HD HSCs coincubated without or with HD MSCs vs CMML MSC sEVs. HD HSCs alone are represented by a green continuous curve, HD HSCs with HD sEVs by a green dotted curve, and HD HSCs with CMML sEVs by a red dotted curve. TF 0.5 pM is represented in purple and MPR in blue. (C) Effect of sEVs on HSC coagulation lag time. (D) Effect of sEVs on HSC proliferation (by thymidine incorporation). CPM, counts per minute.

