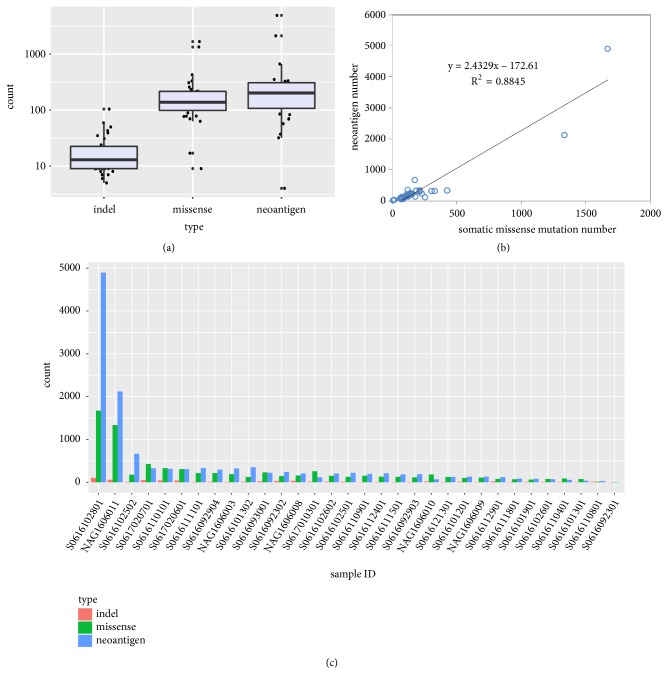
Figure 1.
The overall number of somatic mutations and neoantigens. (a) The boxplot shows the numbers of indels, missense mutations, and predicted neoantigens. (b) The fitted curve between the number of somatic mutations and neoantigens, R2=0.8845. (c) The histogram of numbers of indels, missense mutations, and neoantigens for each patient.

