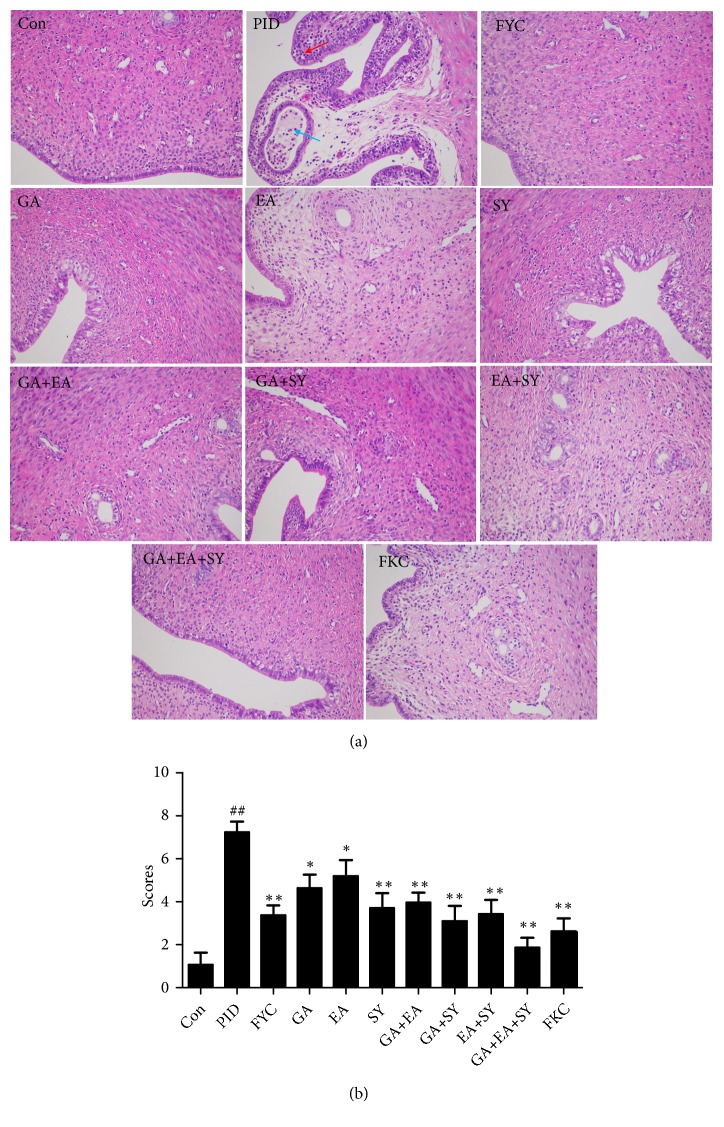
Figure 3.
Effect of FYC and its main components on the pathogen-induced infiltrations of inflammatory cells in the upper genital tract. (b) Typical micrographs (×200) of the uterus stained with H&E. Representative inflammatory cells are indicated as ↑. (b) Semiquantitative scores of the infiltration of inflammatory cells. Each bar represents the mean ± SD (##P < 0.01 vs. control group, ∗P < 0.05, ∗∗P < 0.01 vs. PID group).

