Figure 2.

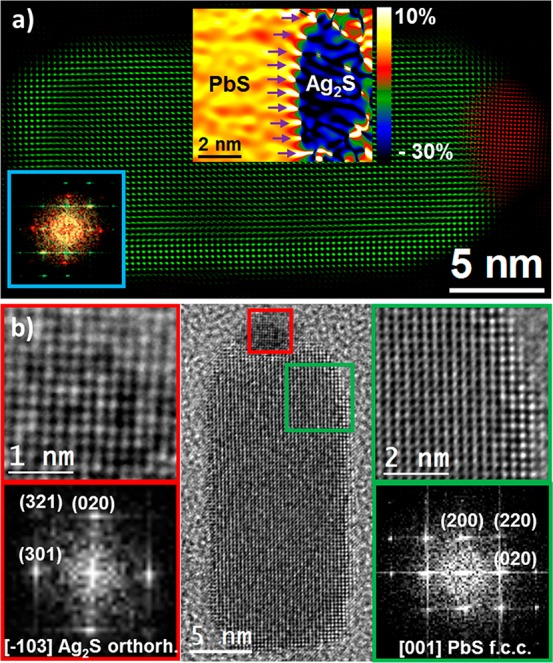
HRTEM image of a single PbS–Ag2S NR. (a) Colored structural map of a typical NR obtained from HRTEM, where red indicates the orthorhombic Ag2S phase and green indicates the face-centered cubic PbS phase. The bottom left inset corresponds to the power spectrum (FFT) used for structural map filtering, with spots colored following the same previous color code. The top middle inset corresponds to a GPA analysis obtained on the heterojunction between the PbS and the Ag2S phases. Purple arrows point to the misfit dislocations. (b) Detailed HRTEM analyses of the different crystal phases and their corresponding indexed FFT.
