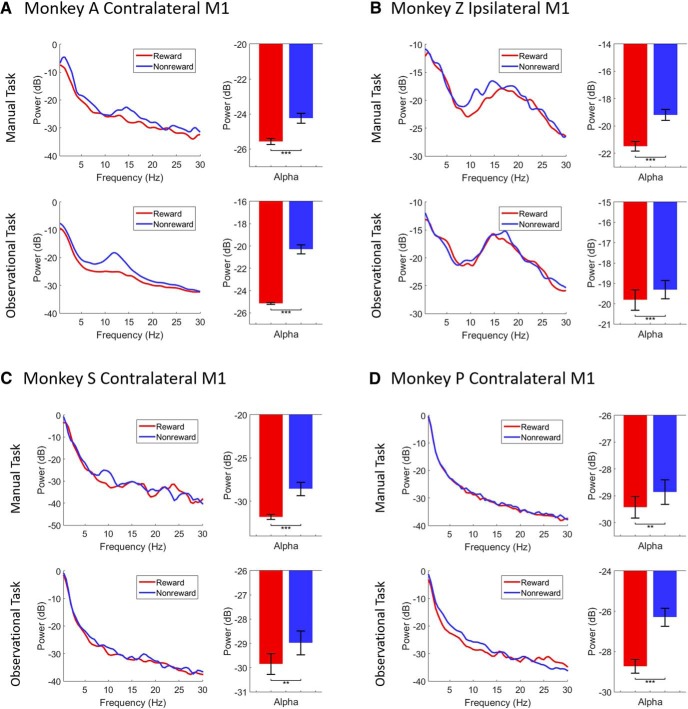
Figure 2.
PSD plots (left column in each subplot) of LFPs for rewarding (red) and nonrewarding (blue) trials across manual (upper row in each subplot) and observational (lower row in each subplot) tasks during center-out reaching (A, B) tasks and grip force (C, D) tasks. Bar graphs show significant differences of α (8-14 Hz, right column in each subplot) band (***p < 0.001, **p < 0.01; Wilcoxon signed-rank test). Error bars in the bar plots represent SEM.

