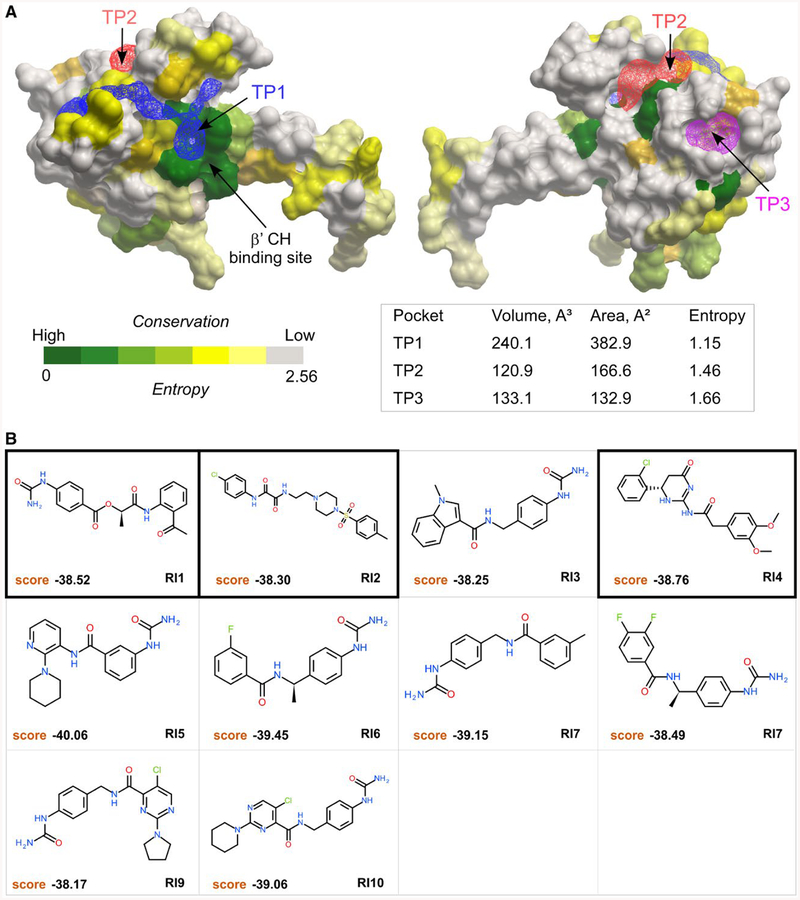
Fig. 5.
Tentative pockets on the RfaH-NTD and structures of potential inhibitors. A. Three tentative pockets (TP1, blue; TP2, red; and TP3, magenta) identified by ICMPocketFinder tool in ICM-Pro v3.8–6a are shown as transparent meshes; the volume and area data are shown in the table below. The RfaH-NTD is shown as a molecular surface where residues are colored by the alignment conservation Entropies (see Methods and Materials), with highly conserved (low Entropy) residues shown in green. The Entropy of each pocket was calculated as the average Entropy of residues around the pocket.
B. Structures and docking scores of the top 10 hits from virtual ligand screening predicted to bind to TP1. Three molecules that show inhibitory activity against RfaH are indicated by thick borders.

