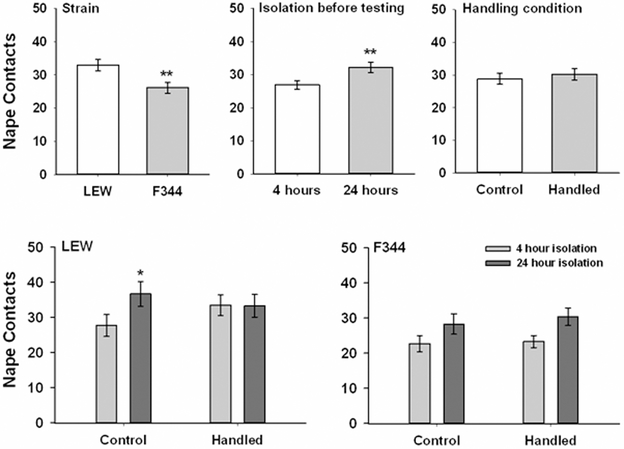
Figure 1.
Mean (± SEM) frequency of nape contacts by control and handled F344 and LEW rats when tested after 4 and 24 hours of isolation. The top 3 panels reflect the results of the main effects associated with strain, isolation before testing and handling condition. The bottom 2 panels reflect the overall data and are collapsed across sex. * p < .05, ** p < .01

