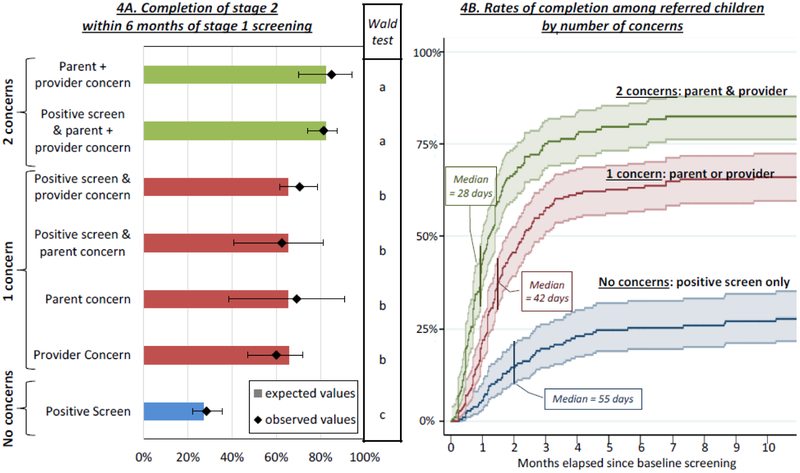
Figure 4:
For each combination of referral criteria, the left panel compares the proportion of families expected to complete stage 2 screening based on the survival analysis (as depicted in the histogram) to those observed to complete stage 2 screening (as depicted by the diamonds with 95% confidence intervals). Results of Wald tests, depicted in the middle panel, reveal that families with two concerns completed stage 2 at higher rates than families with 1 concern, who in turn completed stage 2 at higher rates than families with 1 concern. The panel on the right depicts completion curves for each of these groups along with median days to completion.

