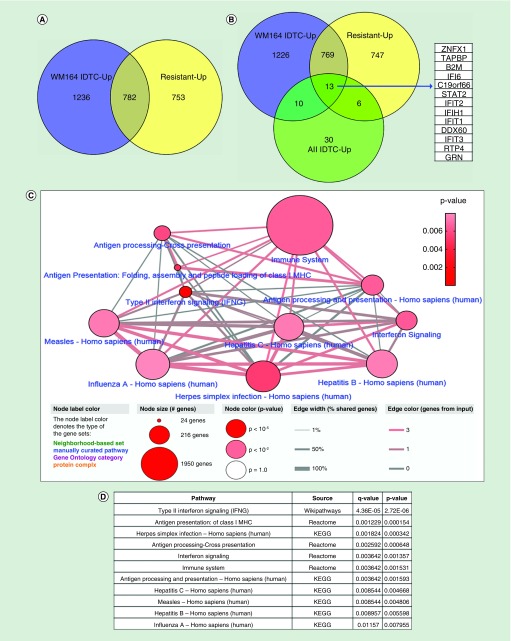
Figure 2. . Common overlapping differentially expressed genes in various resistant models and their protein interaction network.
(A) 2018 upregulated genes of the WM164 IDTC state and 1535 upregulated genes of the WM164 resistant state were selected from gene expression data according to their fold change (FC ≥1.5) and p-value (p < 0.05). (B) Further upregulated genes were integrated with the 59 upregulated genes of the four IDTC models (WM1366, A549, HT29, HCC827) corresponding to three cancer types including-melanoma, lung and colon cancers. A Venn diagram was generated through Venny 2.1 database (http://bioinfogp.cnb.csic.es/tools/venny/). (C) Enriched network and pathways of common upregulated genes. 13 commonly upregulated genes were uploaded in ConsensusPathDB database (http://cpdb.molgen.mpg.de/) with two minimum overlapping genes and a p-value cut-off 0.01. Node size represents the number of genes associated with the corresponding pathways; in other words, the large size of the node indicates a higher number of genes associated with the pathway. Edges of the connecting nodes are distributed according to the genes of input (edge color) and percentage of shared genes of each node (edge thickness). (D) Table showing the top enriched pathway derived from the either KEGG, Reactome or Wikipathways. Pathways are shown in ascending order according to higher p-value.
IDTC: Induced drug-tolerant cell.

