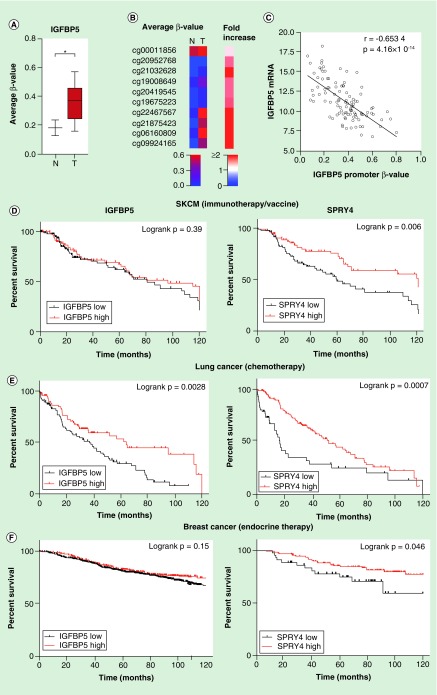
Figure 5. . TCGA data analysis for DNA methylation and overall survival analysis of selected genes.
(A) Average β value of ten promoter probes of IGFBP5 were plotted for SKCM primary tumors (n = 105) and normal sample (n = 2). Statistical analysis was performed by the Mann–Whitney U test where * indicates p < 0.05. (B) An unsupervised histogram was generated based on the β value of each probe without any clustering. (C) IGFBP5 mRNA expression data of melanoma patients were taken from SKCM hi-seq TCGA dataset and plotted with the promoter β value of the same gene (n = 105). (D) A Kaplan–Meier (KM) plot was generated for IGFBP5 and SPRY4 for SKCM patients with immunotherapy or vaccine therapy. Expression value was sorted according to the median (n = 175). (E) KM plot was generated for these genes with lung cancer and breast cancer. Expression values were taken from a subset of lung cancer patients with chemotherapy (n = 176), (F) a subset of breast cancer patients (n = 867) and sorted according to low and high expression from the median of the corresponding genes. Statistical analysis was performed by log rank p-value. All the survival duration was censored to 120 months.
SKCM: Skin cutaneous melanoma.

