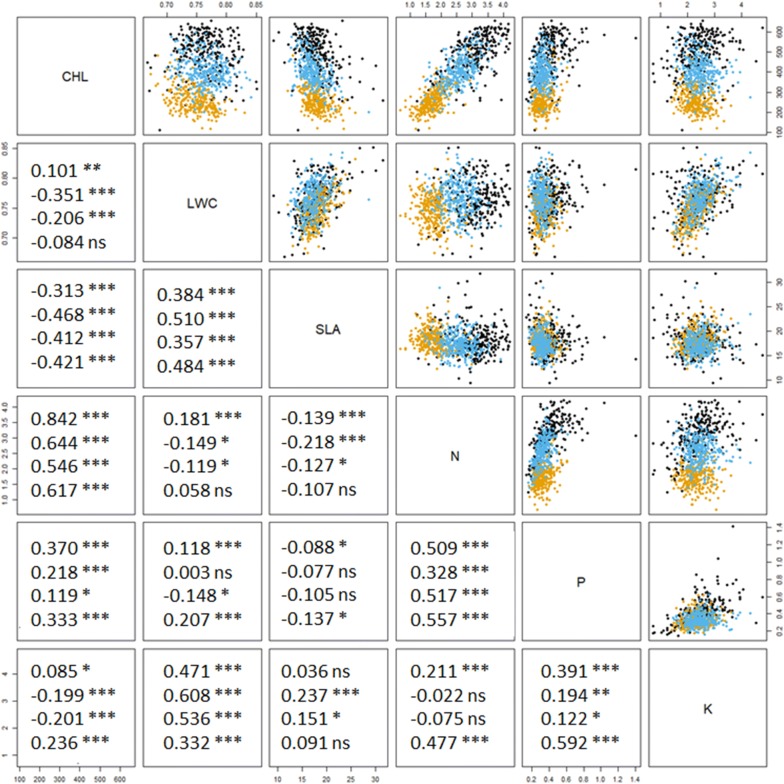
Fig. 2.
The matrix of scatterplots and Pearson’s correlation coefficients among the six maize leaf properties. The orange dots are plants in Field− N; blue dots are in Field + N; and black dots are in greenhouse. The correlation coefficients in the top row were calculated using the plants in Field− N, second row Field + N, third row greenhouse, fourth row by pooling the three groups together. Significance level: *** at 0.001 level, ** at 0.01 level, * at 0.05 level, ns not significant

