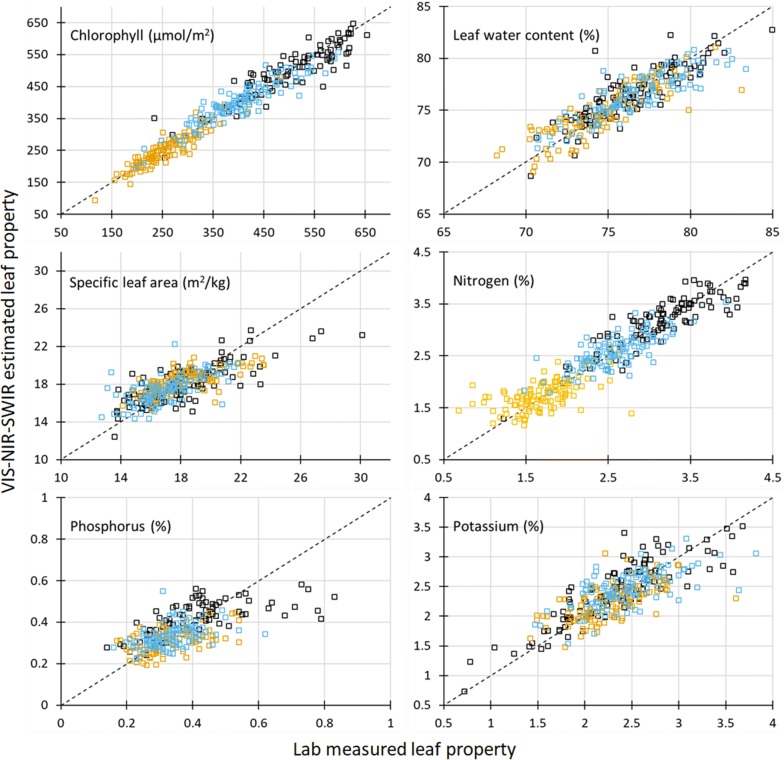
Fig. 4.
Lab-measured versus VIS–NIR–SWIR predicted maize leaf properties for the 40% test set. The orange squares are plants from Field− N; blue squares are plants from Field + N; black squares are plants from greenhouse. The black dashed line is 1:1 line. Statistics for the predictions can be found in Table 1

