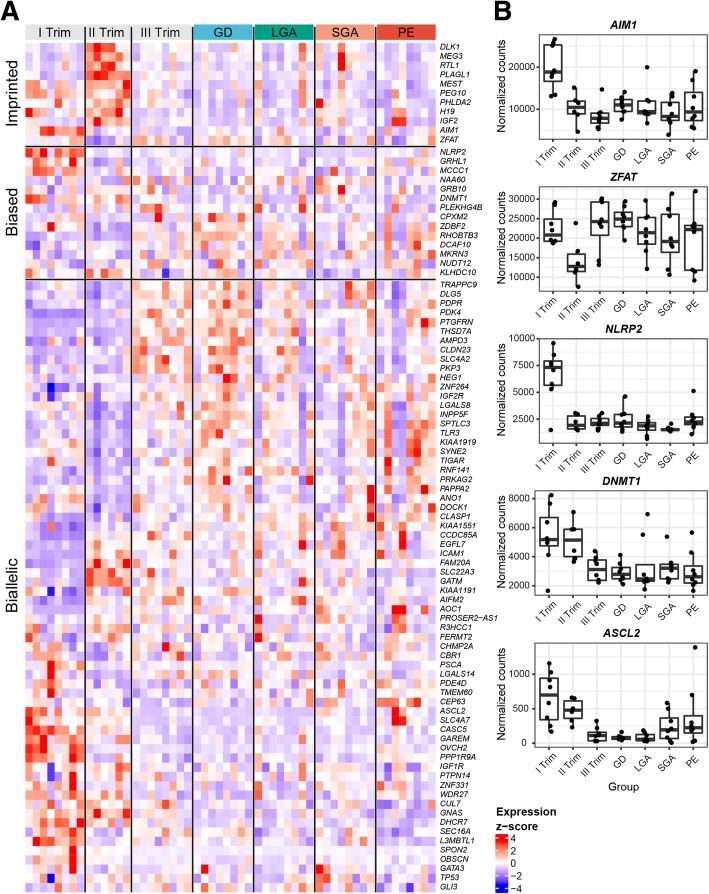
Fig. 3.
Expression of 91 analyzed genes across 54 placentas in normal gestation and term pregnancy complications. a Heatmap with hierarchical clustering of the analyzed genes was generated based on transformed read counts. Gene expression levels were subjected to variance stabilizing transformation in DESeq2 and standardized by subtracting the mean expression across all samples from its value for a given sample and then dividing by the standard deviation across all the samples. The scaled expression value is denoted as the row Z-score. Clustering of the genes (rows) within each of the three parental allelic expression class (imprinted, biased, biallelic) and samples (columns) within the clinical subgroups was based on Minkowski distance. b Expression dynamics of some examples of imprinted (AIM1, ZFAT), biased (NLRP2, DNMT1), and biallelic (ASCL2) genes expressed as normalized read counts. GD, gestational diabetes; LGA, large-for-gestational-age newborn; PE, preeclampsia; SGA, small-for-gestational-age newborn; Trim, trimester

