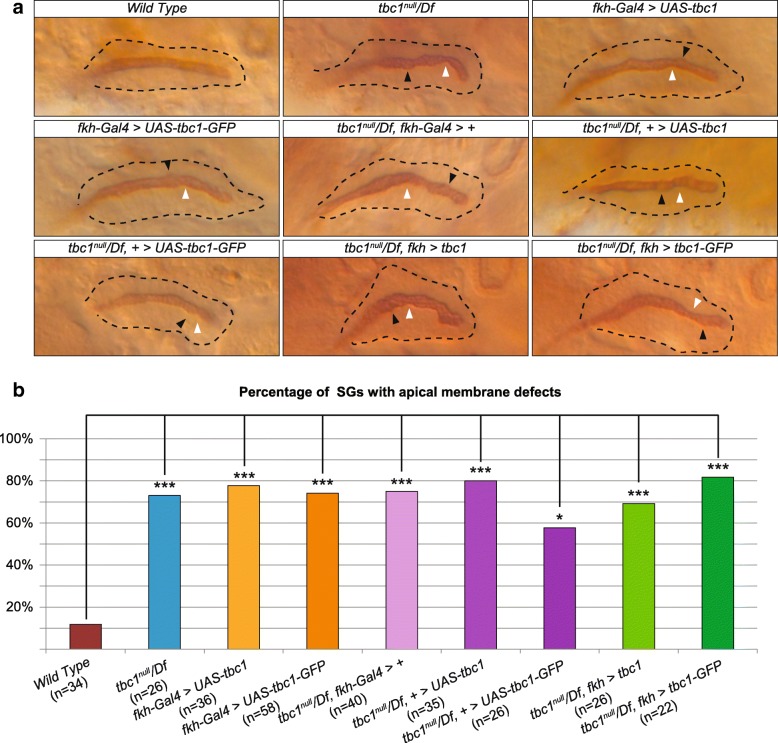
Fig. 6.
Loss and mis-expression of tbc1 results in apical membrane irregularities. a Examples are shown of SGs from WT embryos and embryos either missing or overexpressing Tbc1. Black arrowheads indicate bulges and white arrowheads indicate constrictions. b Histogram showing the percentage of SGs with apical membrane irregularities from all of the genotypes shown in C. Wild-type SGs are mostly smooth, whereas all other genotypes show significant increases in apical surface irregularities (Fisher’s test). *: p-value = 0.002, ***: p-value< 10− 5

