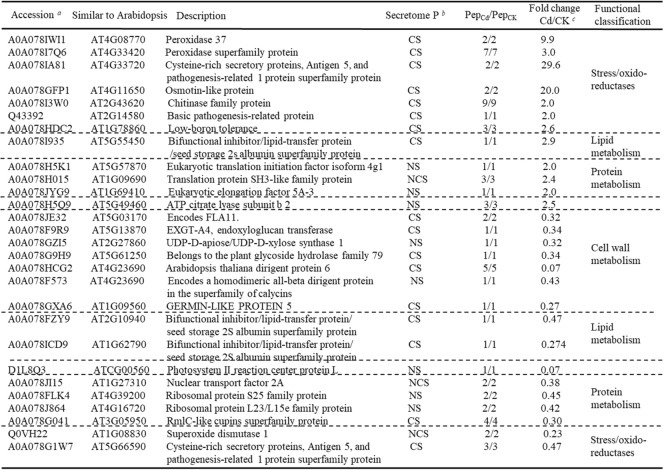
Table 2.
Proteins that significantly changed in abundance among the identified proteins affected by Cd (ANOVA, p ≤ 0.05 and fold ≥2 or ≤ 0.5)
aAccession indicates protein UniProt database entry
bThe SecretomeP column indicates results from subcellular classification. CS = Classical secretory proteins, NCS = non-classical secretory proteins, NS = non-secretory proteins
PepCd/PepCK indicates the number of peptides assigned to a protein and number of peptides used for quantification
cAbundance changes (Fold Cd/control) were calculated by dividing the relative mean abundances in mean Cd by that of the control samples (mean control)

