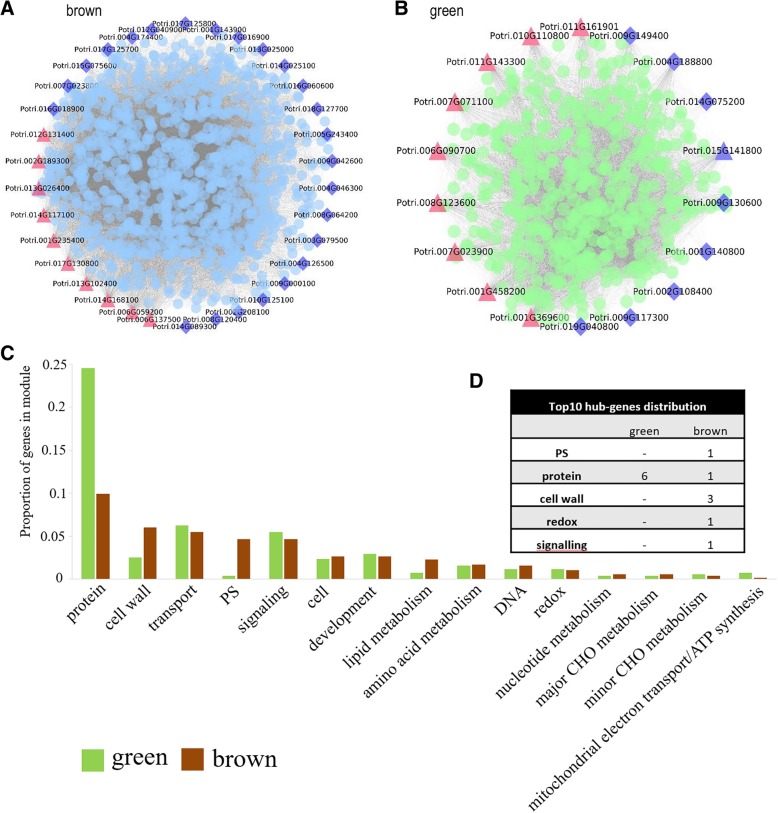
Fig. 5.
Brown- and green-module genes and networks. a Correlation network of genes in the brown module (stage 5). b Correlation network of genes in the green module (stage 3). Red triangles indicate the top-10 hub genes, and blue diamonds indicate transcription factors. c Distribution statistics of high-connectivity-node functional genes in brown and green modules. d Distribution of top-10 hub genes. A dash indicates the absence of hub genes associated with a given function in that module

