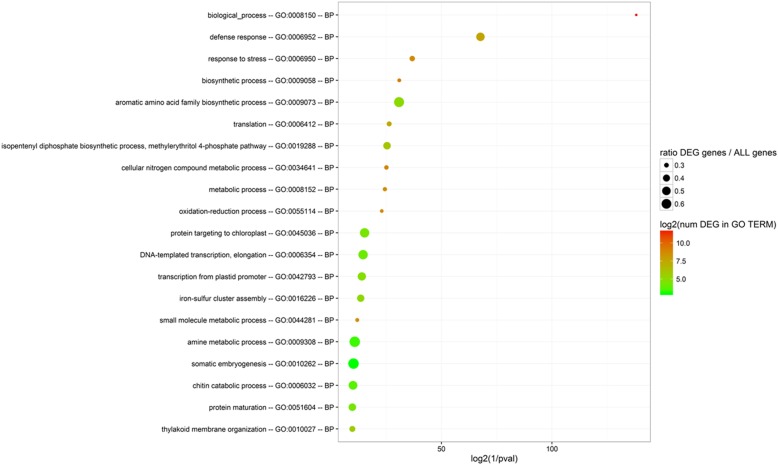
Fig. 1.
GO enrichment for Biological Process domain in the comparison of the constitutive transcriptomes of Chardonnay versus Tocai friulano. All noSt replicate treatments were considered. GO IDs and corresponding GO terms are as specified in the y-axis. In order to place most significantly enriched GOs at top on the y-axis, GOs are sorted according to decreasing log2(1/p-value) on the x-axis. The absolute number of DEGs that matched the GO term (log2-transformed) is indicated by the color of each spot, whereas the size of each spot shows the ratio of DEGs versus all grapevine genes matching the same considered GO term

