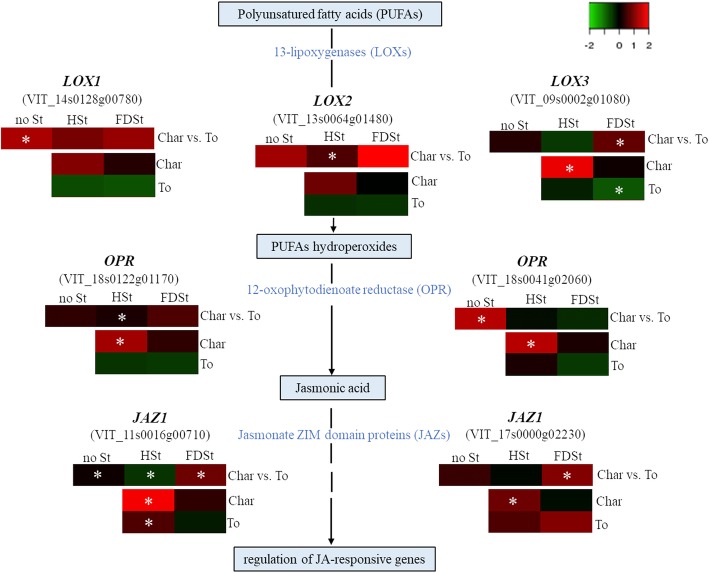
Fig. 3.
Transcriptional modulation of genes involved in the jasmonic acid pathway. Relative expression levels obtained by qRT-PCR analysis of three 13-lipoxygenases (VIT_14s0128g00780, VIT_13s0064g01480, VIT_09s0002g01080), two 12-oxophytodienoate reductase (VIT_18s0122g01170, VIT_18s0041g02060) and two genes encoding for jasmonate ZIM domain protein (VIT_11s0016g00710, VIT_17s0000g02230). The expression of each gene is represented by green-red heatmap. Differences in gene expression, evaluated on noSt, HSt and FDSt treatments (different columns), between Chardonnay and Tocai friulano are reported in the first row of each heatmap (Char vs. To), where red means genes with higher expression in T. friulano compared to Chardonnay and green means genes with higher expression in Chardonnay compared to T. friulano. The gene modulation induced by HSt and FDSt (different columns) in each grapevine cultivar is reported in the second and third rows (Char and To, respectively), where green and red correspond to low or higher transcriptional levels, respectively. Asterisks denote a significant gene modulation (p<0.05)

