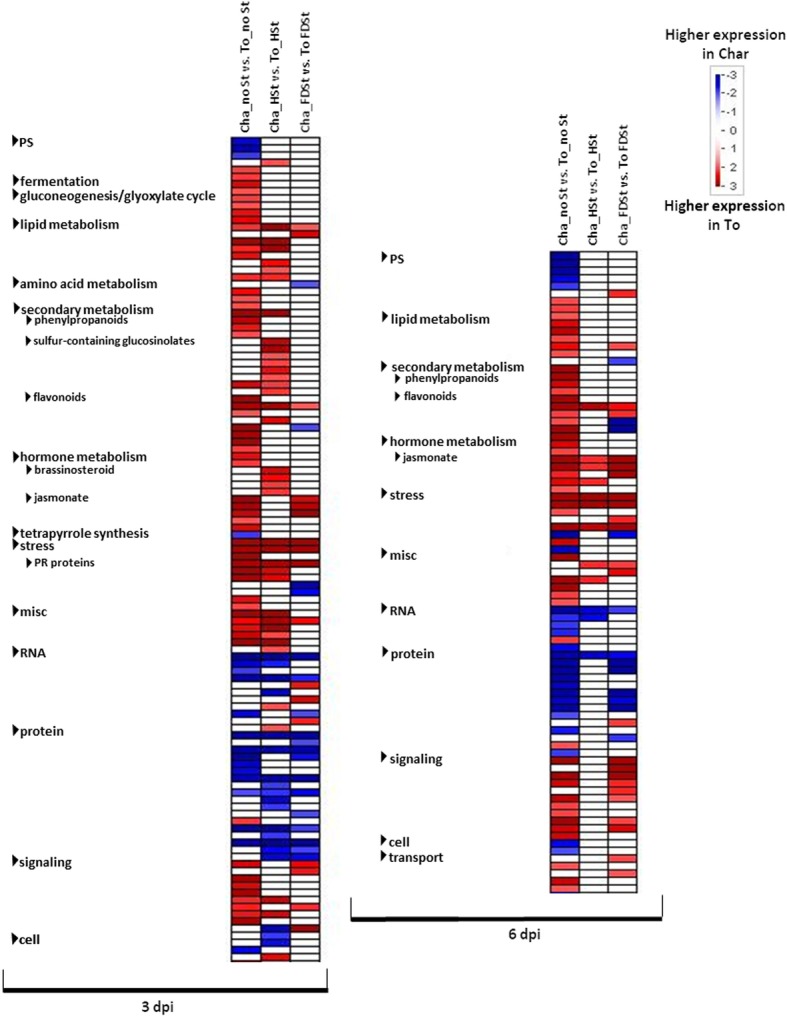
Fig. 5.

Overview of the significantly affected functional categories in the comparisons between Chardonnay and Tocai friulano. Changes in transcript levels are presented as log2 fold changes. The data were subjected to Wilcoxon test in PageMan, and the results are displayed in false-color code. Bins colored in red are significantly more expressed in T. friulano compared to Chardonnay, whereas bins colored in blue are significantly more expressed in Chardonnay compared to T. friulano. Differences in gene expression between the two varieties evaluated on noSt (Cha_noSt vs. To_noSt), HSt (Cha_HSt vs. To_HSt) and FDSt (Cha_FDSt vs. To_FDSt) treatments are reported on different columns. Changes in transcript levels registered at 3 and 6 dpi are shown
