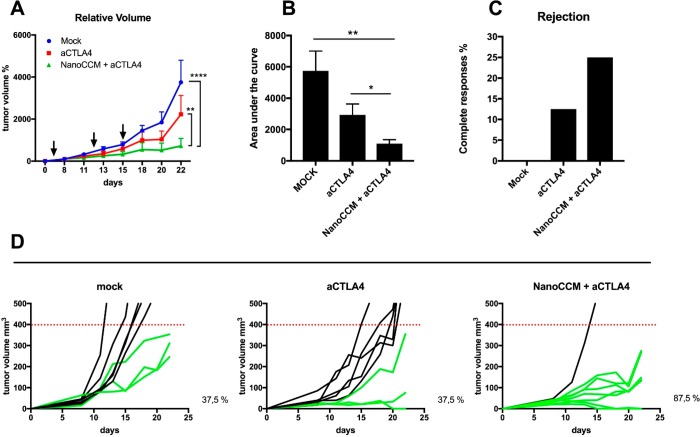
Figure 6.
The efficacy of the anti-tumor effect of the vaccination with biohybrid nanoparticles is increased by co-administration of CTLA-4 checkpoint inhibitor. Female C57BL6/J mice were engrafted with 2.5 × 10⁵ B16.OVA cells on the right flank. After 6 days, mice were randomized into 3 groups and treated subcutaneously with 5.4% isotonic glucose solution (mock group), intraperitoneally with 100 μg of anti-CTLA-4 monoclonal antibody, or with tumor-membrane coated TOPSi@AcDEX nanoparticles (NanoCCM) + anti-CTLA4 antibody. Two more rounds of treatment were performed at days 13 and 15 post-tumor engraftment. (A) Tumor volumes at each time point were normalized against the initial tumor volume. Then tumor growth curves were built by plotting the mean ± SEM of tumor volumes for each group. (B) The area under the curve (AUC) of the growth curve of each mouse is plotted in the box and whiskers graphs (Tukey’s representation). (C) The number of complete responses (i.e., cured mice) for each group is reported. (D) Single growth curves are reported for each group. Responders (green curves) are defined as mice which show an absolute tumor volume lower than 400 mm3. The percentage of responders in the group is reported next to each graph. Statistical analysis of tumor growth was done by two-way ANOVA with Tukey’s multiple comparison correction. The AUCs were analyzed by unpaired Student’s t test; *p < 0.05; **p < 0.01; ****p < 0.0001.

