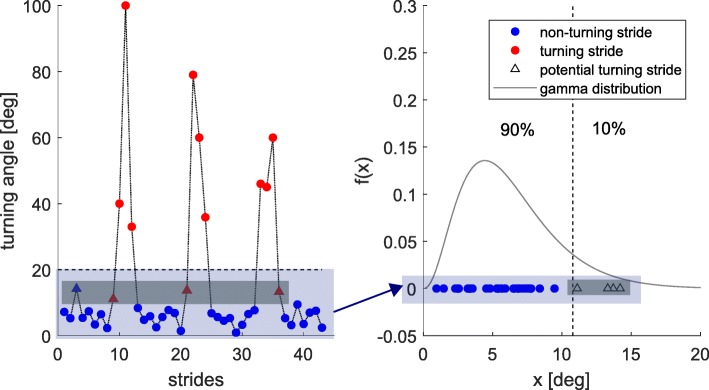
Fig. 5.
Turning isolation algorithm for an exemplary 4x10 m gait sequence and one foot. (Left) Absolute value of the TA including: Strides with TA larger than 20∘ (red circles), straight strides (blue circles), potential turning strides adjacent to already assigned turning strides (red triangles) and potential turning strides not adjacent to already assigned turning strides (blue triangles). (Right) Gamma distribution fitted based on all strides with TA smaller than 20∘. The largest 10% are potential turning strides (triangles) and the remaining strides are straight strides (blue circles)

