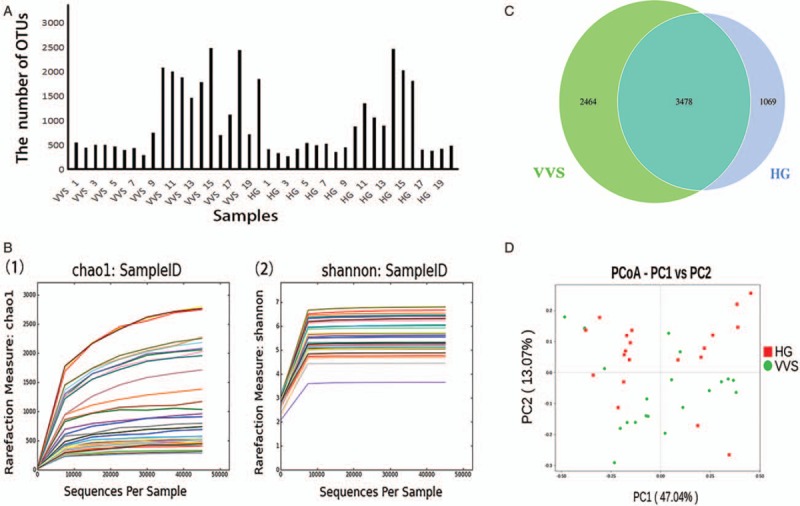
Figure 1.

Characteristics of the microbiota in the 2 groups. (A) Distribution diagram of the OTUs of each sample for all subjects. The abscissa represents the samples, and the ordinate represents the number of OTUs. (B) Rarefaction curves (1) based on observed-species indexes and (2) based on Shannon indexes. (1) The abscissa represents the number of randomly selected sequences, and the ordinate represents the annotated number of OTUs based on the selected sequences. (2) The abscissa represents the number of randomly selected sequences and the ordinate represents the calculated Shannon index based on the selected sequences. (C) Venn graph. Venn graph showing the unique OTUs of VVS group (green color), the unique OTUs of the healthy control group (blue color), and the common OTUs in the two groups (cyan color). (D) PCoA plot. PCoA plot showing the dispersal of microbiota from the VVS patients (green dot) and healthy controls (red square). PCoA1, principal coordinate analysis 1 for 47.04% of the total variation; PCoA2, principal coordinate analysis 2 for 13.07% of the total variation. HG: Healthy group; OTUs: Operational taxonomic units; PC1: The first principal coordinate; PC2: The second principal coordinate; PCoA: Principal coordinate analysis; VVS: Vasovagal syncope.
