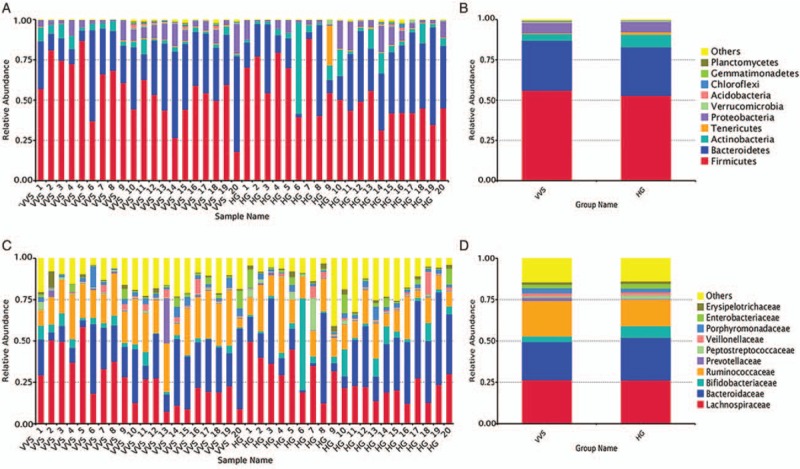
Figure 2.

The distribution of gut microbiota in phylum level and family level of the two groups. (A) Top 10 bacteria at the phylum level of each sample. (B) Top 10 bacteria at the phylum level of each group. (C) Top 10 bacteria at the family level of each sample. (D) Top 10 bacteria at the family level of each group. HG: Healthy group; VVS: Vasovagal syncope.
