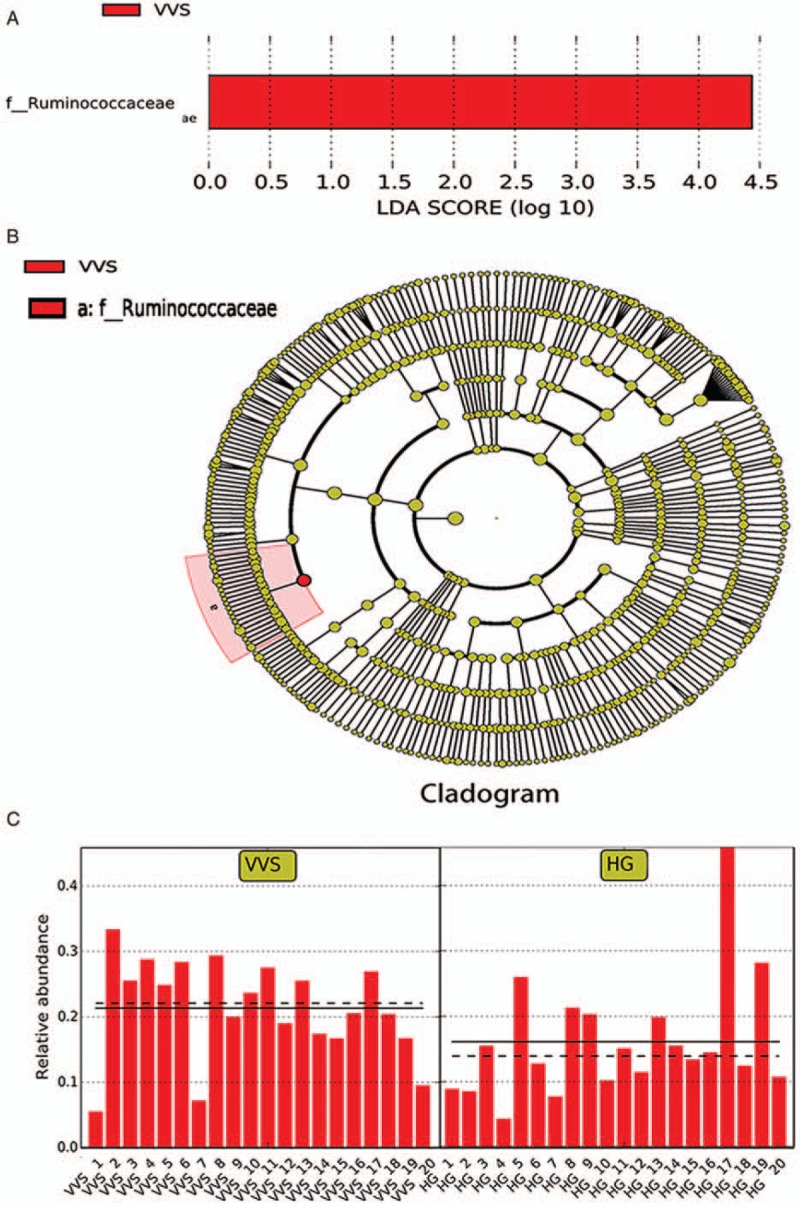
Figure 3.

The predominant bacteria in vasovagal syncope group using LEfSe. (A) Histogram of the LDA scores. Histogram of the LDA scores computed for bacteria that were differentially abundant between the VVS and healthy children; VVS-enriched bacteria are indicated with a positive LDA score. The LDA score indicates the effect size and ranking of each differentially abundant taxon. (B) Cladogram. In the cladogram, circles radiating from the inside to the outside, with the diameter positively correlated with the relative abundance, represent the different classification levels of kingdom, phylum, class, order, family, genus, and species. Yellow indicates no significant difference between the two groups and red indicates an important role in the VVS group. (C) Relative abundance of Ruminococcaceae in each sample. The solid line shows the average, and the dotted line shows the median. HG: Healthy group; LDA: Linear discriminant analysis; VVS: Vasovagal syncope.
