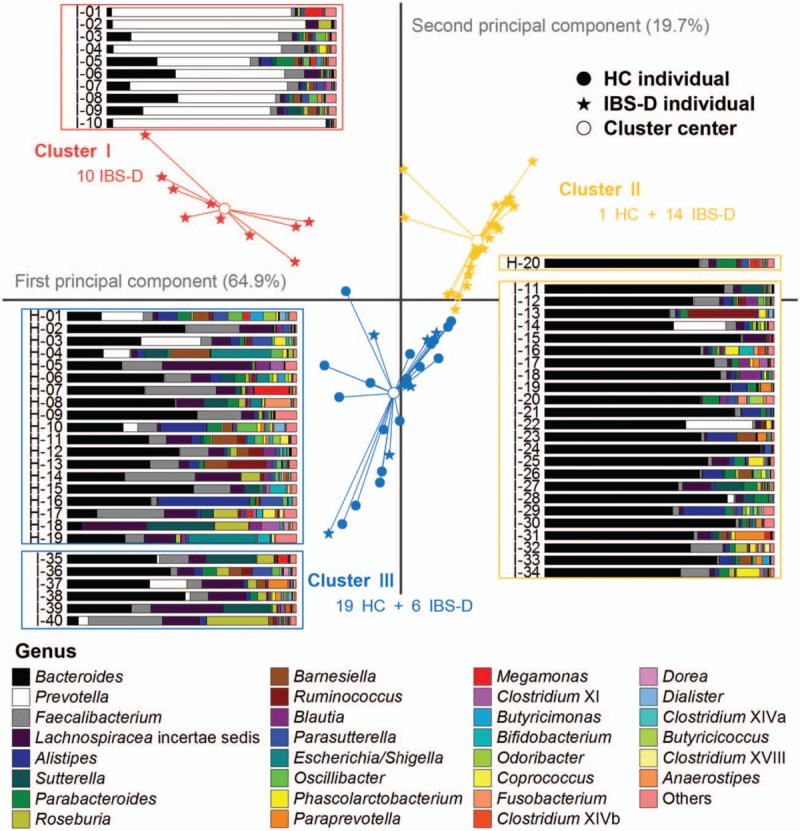
Figure 4.

Genus-level composition and PCA plots of individuals for the HC and IBS-D groups. Scatters in different shapes represented HC individuals, IBS-D individuals, and cluster centers, with colors to distinguish the three clusters (red for I, yellow for II, and blue for III). Genus composition of each individual was displayed by stack bars, and the fill colors corresponded to genera listed in the legend below. HC: Healthy control; IBS-D: Diarrhea-predominant irritable bowel syndrome, PCA: Principal component analysis.
