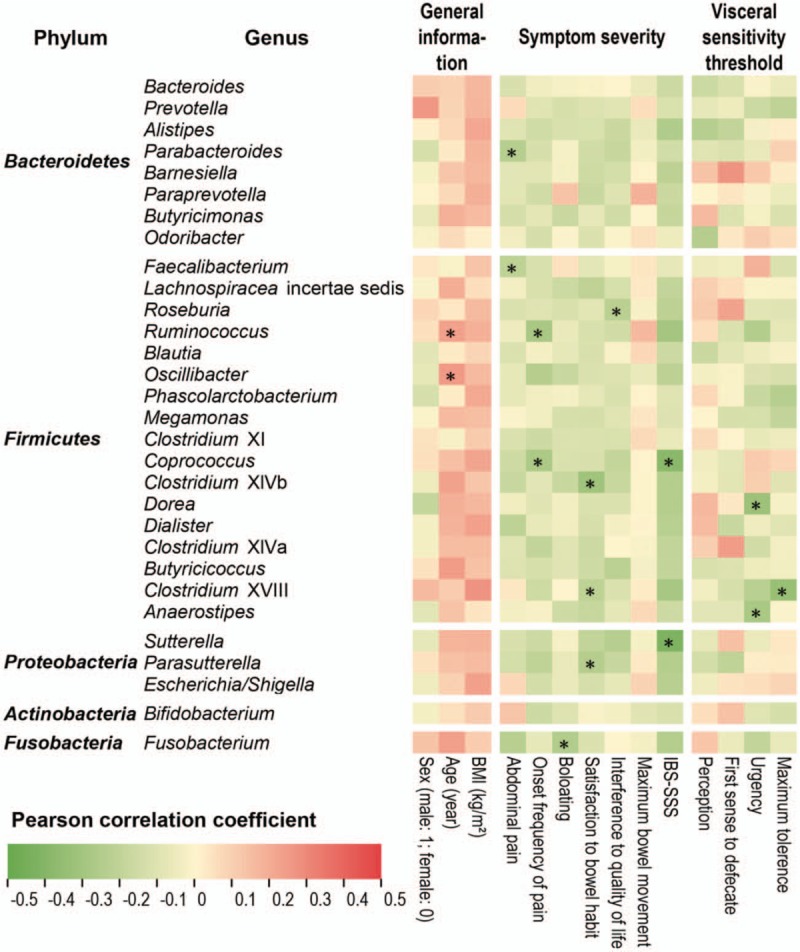
Figure 6.

Pearson correlation between 14 clinical indices (three indices of general information and 11 IBS symptom features) and top 30 genera. The heat map showed the Pearson correlation coefficient between each index and each genus, where red was positive and green was negative as legend. The position marked by an asterisk meant that the correlation was significant (q < 0.05). BMI: Body mass index; IBS: Irritable bowel syndrome.
