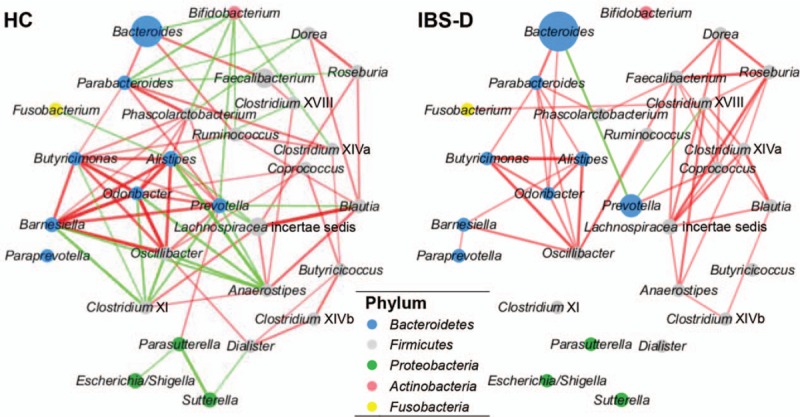
Figure 9.

Local parts of genus networks. Colors of bubbles and connections remained the same with Figure 8. In addition, size of bubble stood for the average abundance, while thickness and transparency of connection simultaneously reflected the correlation magnitude in this figure. Values were displayed after a linear transformation to guarantee visibility. HC: Healthy control; IBS-D: Diarrhea-predominant irritable bowel syndrome.
