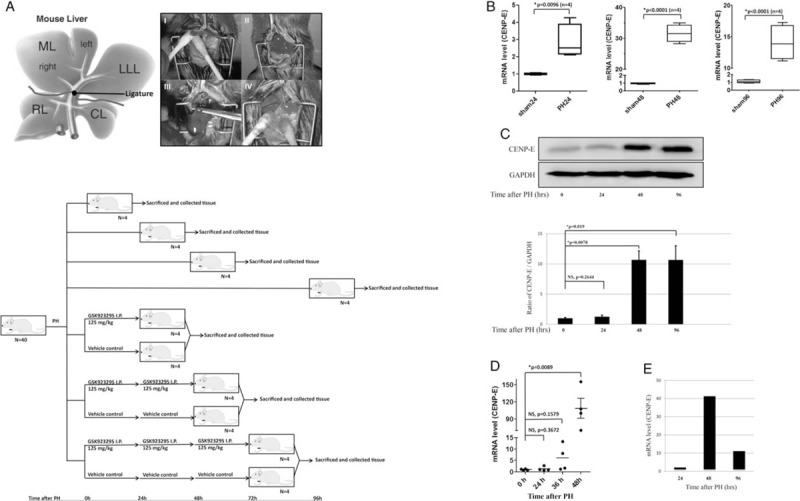
Figure 3.

Expression of CENtromere Protein E (CENP-E) during mouse liver regeneration after PH. (A) Schematic representation of murine liver anatomy (Upper). I-II, Ligatured LLL, ML. III-IV, Resected LLL, ML. Diagram of procedures used to investigate the influence of GSK923295 in PH mouse model (bottom). (B) Each respectively, total RNAs were isolated from regenerative livers of PH mice and livers of sham-operated mice (24, 48, and 96 h), and the amounts of CENP-E mRNAs were determined as described in Materials and Methods by qPCR. (C) Western blotting analysis of CENP-E from lysates of livers at 24, 48, and 96 h after PH. (D) CENP-E expression during liver regeneration in response to PH in GEO database. The ordinates represent relative mRNA amounts and the abscissas represents the periods of time (H) after PH. (E) Expression of CENP-E in liver regeneration after PH using microarray analysis. CL: Caudate lobe; LLL: Left lateral lobe; ML: Middle lobe; qPCR: Real-time quantitative PCR detecting system; RL: Right lobe.
