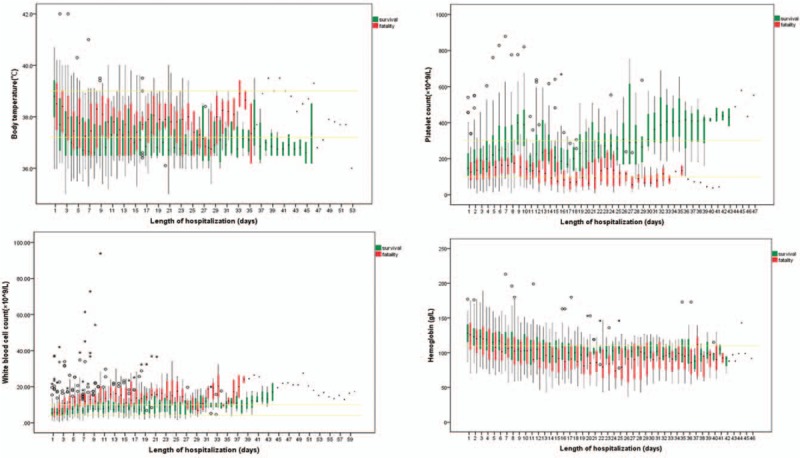
Figure 1.

Variation of body temperature, platelet count, white blood cell count, hemoglobin between the fatality and survival groups during hospitalization among 143 H7N9 cases. The yellow lines represent the average value of survival and fatality groups; The graphs show box plots: the black dot in each colored bar is the median; the colored sections are the interquartile range (from the first to the third quartiles); circles represent exceptional values of fatal cases; asterisks represent exceptional values of survival cases.
