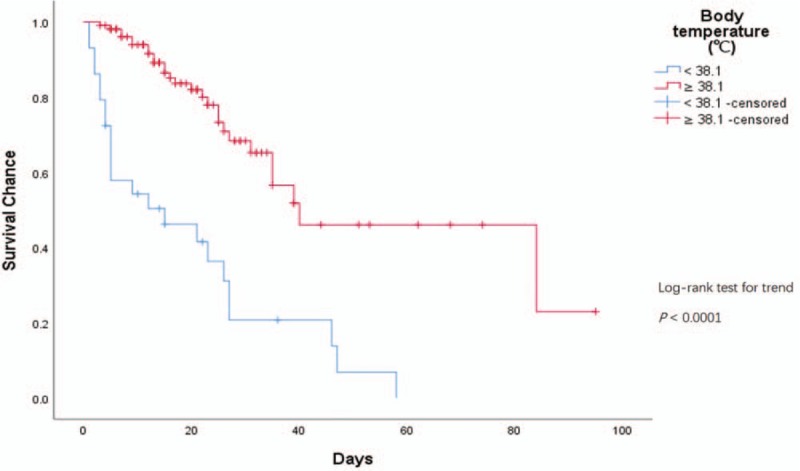
Figure 4.

Kaplan-Meier survival curves of BT (body temperature) average and WBC (white blood cell) average with thresholds for H7N9 survival chance, by duration since onset of illness.

Kaplan-Meier survival curves of BT (body temperature) average and WBC (white blood cell) average with thresholds for H7N9 survival chance, by duration since onset of illness.