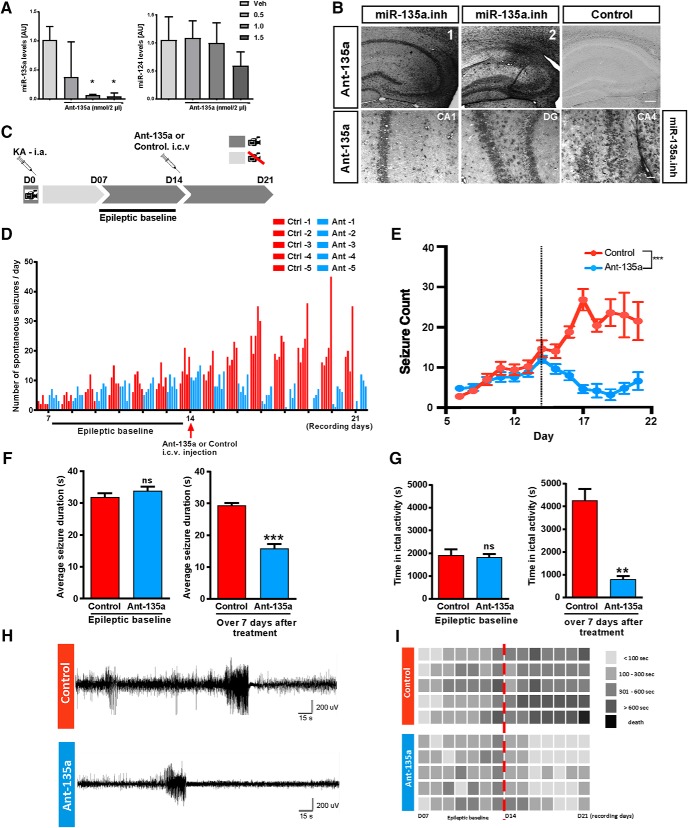
Figure 3.
Ant-135a reduces seizures in the mouse IAK model of epilepsy. A, miR-135a expression levels 24 h after administration of ant-135a. Significant reduction of miR-135a levels at 1.0, 1.5 nmol compared with vehicle injection. No off-target effect observed at 1.0 nmol, but reduction in miR-124 levels was observed at 1.5 nmol. n = 3 mice per group. Normalized to RNU6B. Data are mean ± SEM. *p < 0.05 (one-way ANOVA with Sidak post hoc test). B, LNA ISH for the miR-135a inhibitor probe in ant-135a-injected mice. Strong signal for ant-135a is observed in ipsilateral (injected) hippocampus (B1, B2), whereas the control is devoid of specific signal. Scale bar, 200 μm. Ant-135a is taken up by neurons in hippocampal CA1, CA4, and DG regions. Scale bar, 50 μm. C, Male C57BL6 adult mice (∼25 g) were implanted with telemetry devices (Data Systems International) connected to cortical electrodes (both brain hemispheres) for EEG recordings. After appropriate surgical recovery, mice were connected to the EEG equipment and underwent intra-amygdala KA-induced SE on D0. Telemetry devices were turned off and reactivated on D07 to record a 7 d “epileptic baseline.” On D14, mice were intracerebroventricularly injected with ant-135a or its scramble control, and continuously monitored for 7 d (D14 to D21; “after antagomir treatment period”). D, Graph represents the total number of SRSs per day per mouse. Epileptic baseline: No significant difference was detected between treated and control animals in seizure frequency during the 7 d of epileptic baseline (p = 0.743). After antagomir treatment: Following treatment (on D14), a strong decrease in the number of seizures was detected in the antagomir-treated group starting from D15. E, Seizure count is represented as mean ± SD over the EEG recording period. Application of ant-135a at day 14 (dotted line) resulted in a significant decrease in seizure count with respect to time. n = 5 for control and ant-135a. ***p < 0.001 (mixed-design, repeated-measures GLM; day/treatment interaction). F, Average seizure duration: Epileptic baseline: No significant difference between treated and control animals in seizure duration during the 7 d of epileptic baseline (p = 0.4721). ns, not significant. After antagomir treatment: Following treatment (on D14), ant-135a-treated mice presented significantly shorter seizures than the control group; n = 5 mice per group. ***p < 0.001 (t test). G, Time spent in ictal activity: Epileptic baseline: No significant difference between treated and control animals in total time spent in seizures during the 7 d of epileptic baseline (p = 0.7546). ns, not significant. After antagomir treatment: Following treatment (on D14), ant-135a-treated mice spent significantly less time in seizures than control mice; n = 5 mice per group. **p < 0.01 (t test). H, Representative EEG traces of spontaneous seizures 3 d after treatment with ant-135a (bottom) or control (top). I, Total time spent in seizures. Diagram represents seizure burden per day (seconds) per mouse before and after the antagomir treatment (dotted line). A control mouse with high number of seizures died on day 7 after antagomir treatment period.

