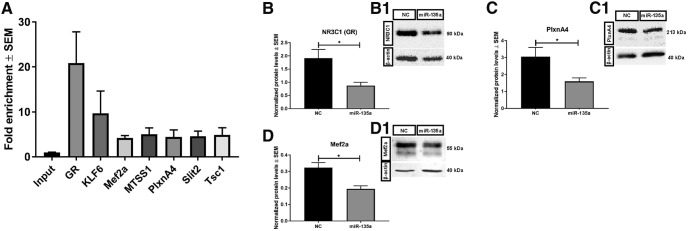
Figure 6.
Validation of bio-IP targets. A, Several of the selected targets were tested by qPCR and were significantly enriched in the IP samples compared with inputs. n = 3 samples per group. Bar graphs and representative blot images showing GR (B,B1), PlexinA4 (C,C1), and Mef2a (D,D1) protein levels normalized to β-actin after miR-135a overexpression in N2A cells. All of the validated targets were significantly downregulated after miR-135a overexpression compared with negative control (NC) condition. n = 4 independent transfections and were repeated twice. Data are mean ± SEM. *p < 0.05 (t test).

