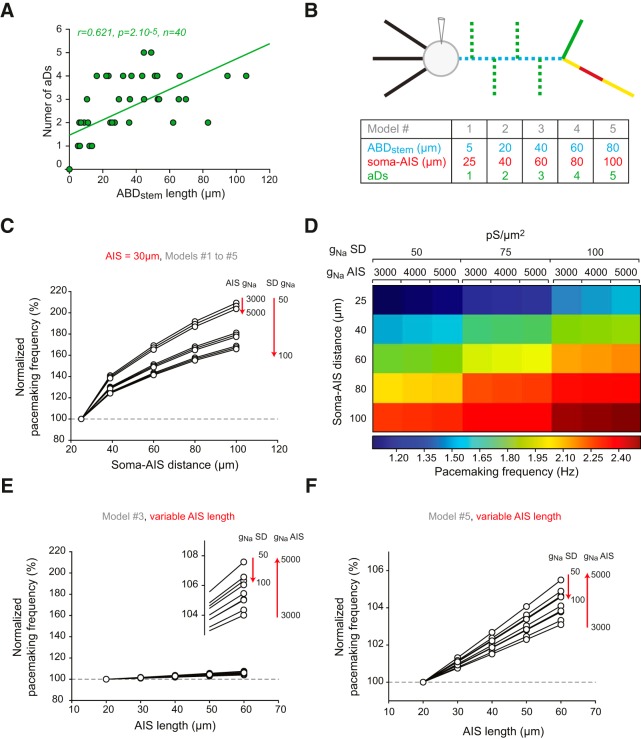
Figure 10.
Implementing ABD complexity modifies the effect of morphological variations on pacemaking frequency. A, Scatter plot representing the significant correlation between ABDstem length and number of aDs observed in the 40 reconstructed SNc DA neurons. B, Schematic representation of the variations in soma-AIS distance and the associated variation in number of aDs applied to the multicompartment model. C, Line and scatter plot representing the effect of changing soma-AIS distance on the pacemaking frequency in the model. The 9 combinations of SD gNa and AIS gNa already presented in Figure 9 were used. D, Heatmap representation of the raw values of pacemaking frequency depending on SD gNa, AIS gNa (horizontal axis), and soma-AIS distance (vertical axis). E, Line and scatter plot representing the effect of changing AIS length on pacemaking frequency in the average-morphology model (soma-AIS = 60 μm, 3 aDs). Inset, Expanded view of the points for AIS length = 60 μm. F, Line and scatter plot representing the effect of changing AIS length on pacemaking frequency in the model with 5 aDs (soma-AIS = 100 μm).

