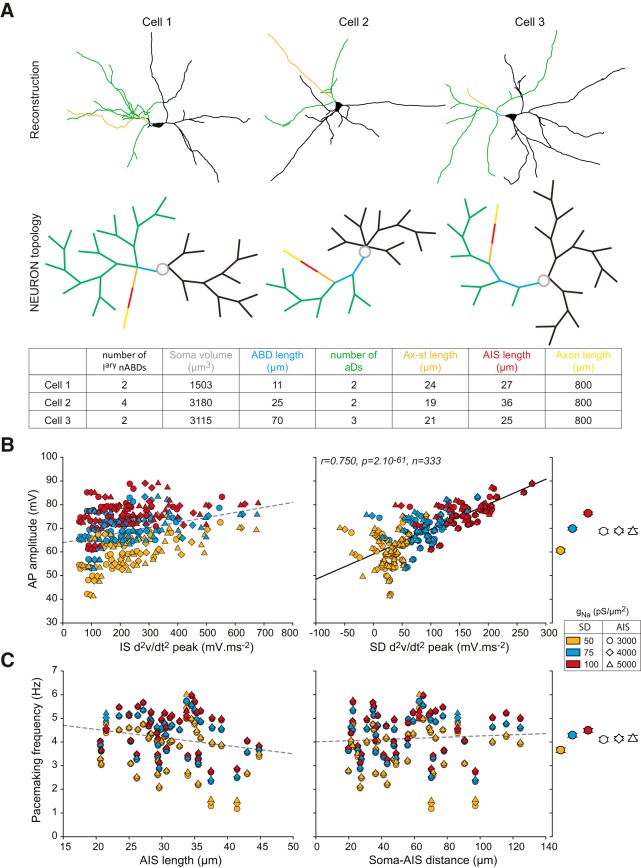
Figure 11.
Simulating electrophysiological output using realistic morphologies. A, Skeleton (top) and topological representations from the NEURON software (middle) for 3 cells representative of the morphological diversity across our 37 neuron sample. Bottom, Values of the main morphological parameters for the 3 cells presented above. B, Scatter plots representing the relationship between IS d2v/dt2 peak (left) or SD d2v/dt2 peak (right) and AP amplitude in the 37 real-morphology models. The data from 9 simulations (combinations of 50–100 pS/μm2 SD gNa and 3000–5000 pS/μm2 AIS gNa, distinguished by colors and symbols) are represented (37 × 9 = 333 points). Far right, The average AP amplitude ± SEM for each SD gNa density and each AIS gNa density is represented. C, Scatter plots representing the lack of relationship between AIS length (left) or soma-AIS distance (right) and pacemaking frequency in the 333 real-morphology simulations. Far right, The average pacemaking frequency ± SE for each SD gNa density and each AIS gNa density is represented. Plain lines indicate significant correlations between parameters. r, p, and n values are given on the corresponding plots. Dotted lines indicate nonsignificant correlations.

