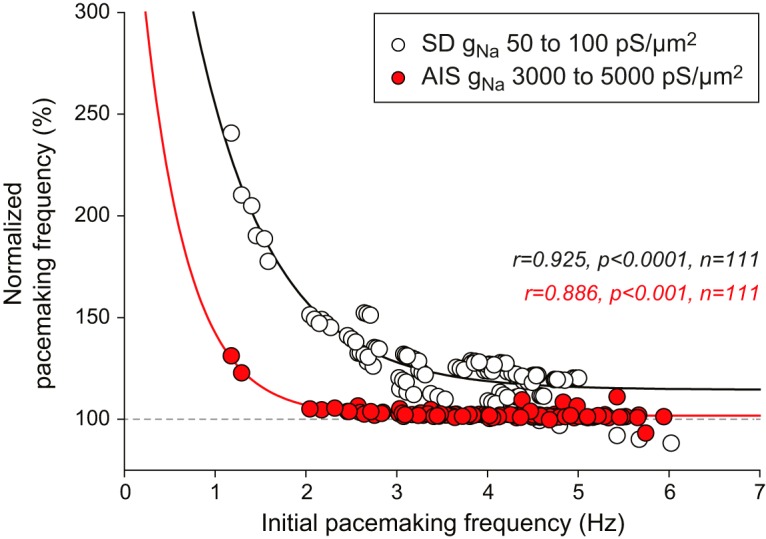
Figure 12.

State dependence of the effect of SD and AIS gNa on pacemaking frequency in the real-morphology models. Scatter plot representing the normalized pacemaking frequency for the maximal AIS and SD gNa (5000 and 100 pS/μm2, respectively) as a function of the pacemaking frequency the same models displayed for the minimal AIS and SD gNa (3000 and 50 pS/μm2, respectively). This representation shows that the increase in pacemaking frequency induced by changing gNa (from 3000 to 5000 pS/μm2 or 50 to 100 pS/μm2) is very strongly dependent on the initial frequency of the models, and that varying SD gNa is much more effective than varying AIS gNa. Lines indicate exponential fits of the data.
