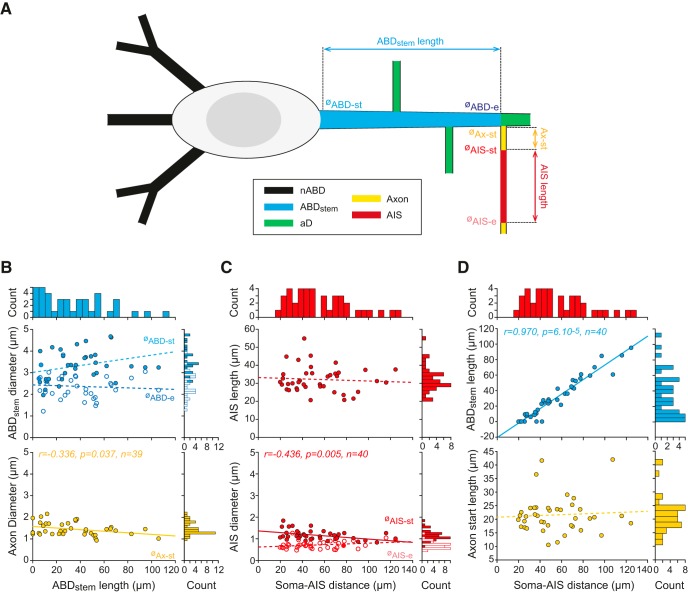
Figure 2.
Detailed analysis of cell-to-cell variations in ABD and AIS morphology. A, Schematic presenting the main morphological parameters analyzed on each SNc DA neuron. The lengths of the stem ABD (ABDstem), the axon start (Ax-st), the AIS (AIS length), the number of aDs, and the number of nABDs were measured. The starting and ending diameters of the stem ABD (ØABD-st, ØABD-e) and of the AIS (ØAIS-st, ØAIS-e) as well as the diameter of the axon start (ØAx-st) were also measured. The schematic also corresponds to the average topology observed in the 40 SNc DA neurons from which these measurements were obtained. B, Scatter plots representing the variation in ABDstem length and its relationship with ABD (top) or axon diameters (bottom). Histograms represent the distribution of values for each parameter shown above or on the right side of the scatter plots. C, Scatter plots representing the variation in soma-AIS distance and its relationship with AIS length (top) and AIS diameters (bottom). Histograms represent the distribution of values for each parameter shown above or on the right side of the scatter plots. D, Scatter plots representing the variation in soma-AIS distance and its relationship with the length of ABDstem (top) or axon start length (bottom). Histograms represent the distribution of values for each parameter shown above or on the right side of the scatter plots. Plain lines indicate significant correlations between parameters. r, p, and n values are given on the corresponding plots. Dotted lines indicate nonsignificant correlations.

