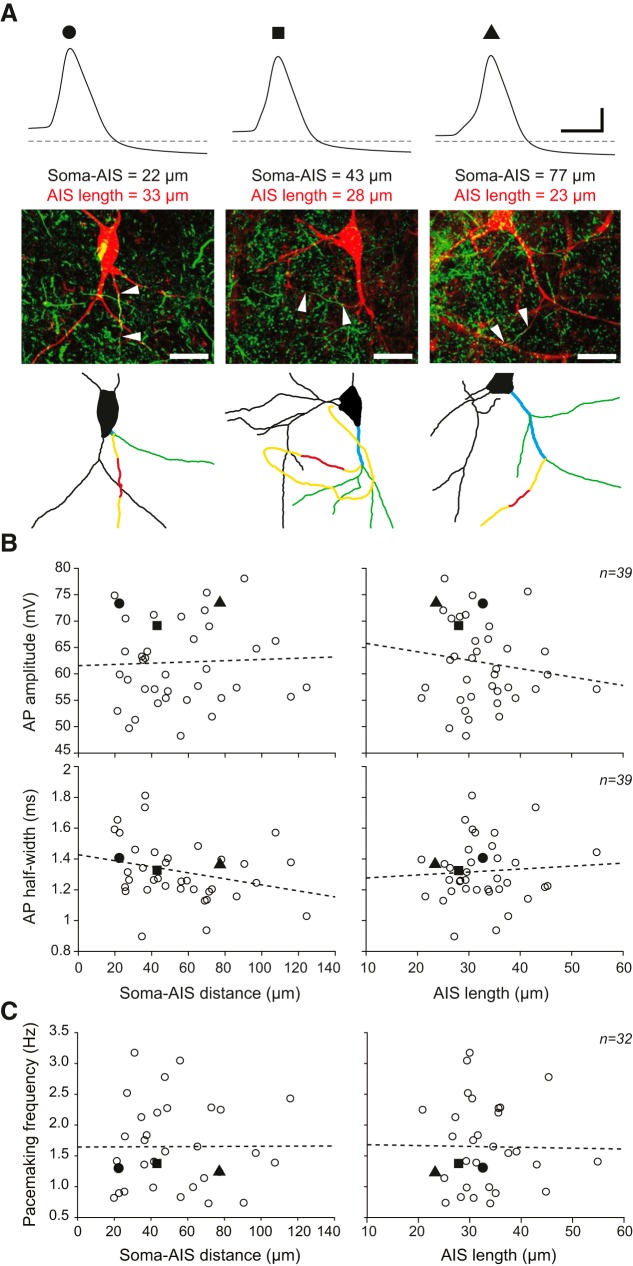
Figure 4.
Absence of correlation between electrophysiological parameters and AIS geometry. A, Top, Somatic current-clamp recordings of the AP in 3 neurons presenting significant variations in soma-AIS distance and AIS length. Middle, Double immunolabeling (neurobiotin/ankyrinG; red/green) of the recorded neurons showing AIS location and length. White arrowheads indicate AIS start and end. Bottom, Skeleton representation of the same neurons indicates the axon, AIS, ABD, and aDs, using the color coding already used in Figures 1 and 2. B, Scatter plots representing the lack of significant correlations between soma-AIS distance (left) or AIS length (right) and AP amplitude (top) or half-width (bottom) observed in 39 recorded and reconstructed neurons. C, Scatter plots representing the lack of significant correlations between soma-AIS distance (left) or AIS length (right) and pacemaking frequency observed in 32 recorded and reconstructed neurons. B, C, Values corresponding to the 3 neurons presented in A are identified by a black circle, square, or triangle. Calibration: A, recordings, 20 mV vertical, 2 ms horizontal; pictures, 25 μm. Horizontal dotted lines indicate −60 mV. B, C, Dotted lines indicate linear regressions (nonsignificant in all cases).

