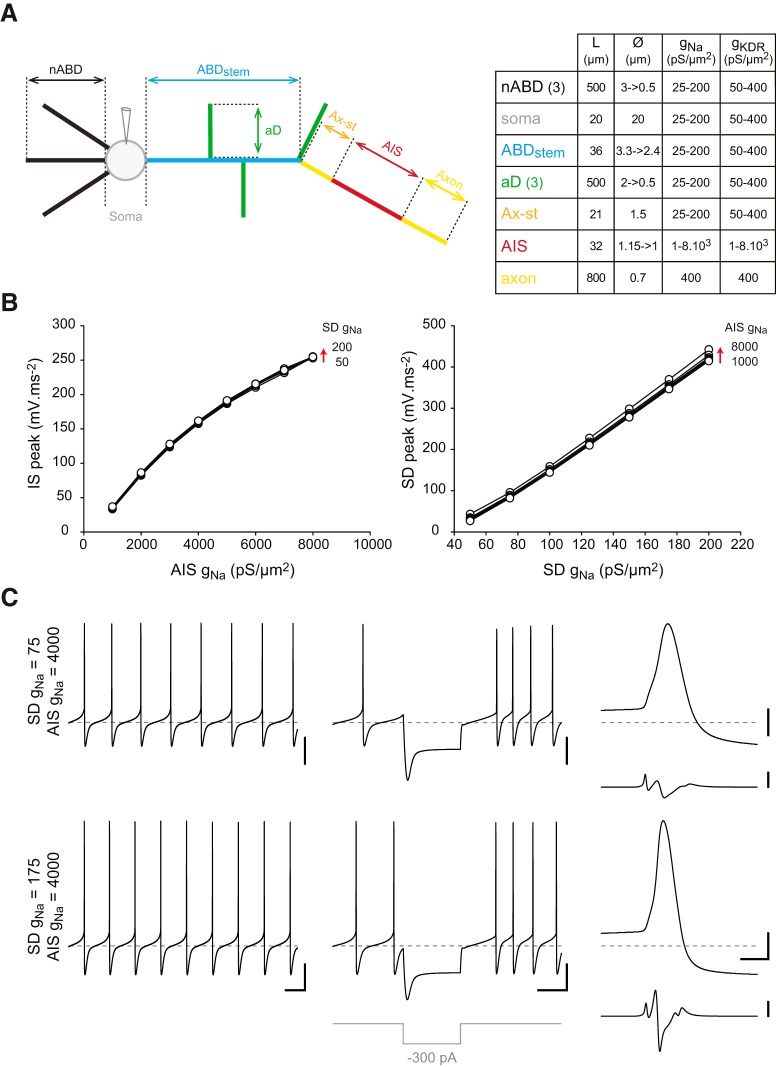
Figure 7.
Validation of the average-morphology model. A, Left, Schematic representation of the average-morphology model depicting all the neuronal compartments included in the simulation. Right, Table indicating the length and diameters of the model compartments. While the axon, axon start (Ax-st) and the soma were modeled as cylinders (constant diameter), all other compartments were modeled as truncated cones. ABD, ax-st, and AIS length and diameters were based on measurements performed on confocal reconstructions of all the neurons included in the study. B, Left, Line and scatter plot representing the relationship between AIS gNa and the amplitude of the IS d2v/dt2 component recorded at the soma. Right, Line and scatter plot representing the relationship between SD gNa and the amplitude of the SD d2v/dt2 component recorded at the soma. The data from 56 simulations (combinations of 50–200 pS/μm2 SD gNa and 1000–8000 pS/μm2 AIS gNa) are represented and show the strict dependence of the two phases of the AP on the respective densities of sodium conductance in the AIS and the SD compartments. C, Voltage traces representing the pacemaker activity (left), the response to a hyperpolarizing current step (middle, −300 pA), and the waveform of the somatic AP and its second time-derivative (right) in the average-morphology model with a low density of SD gNa (75 pS/μm2, top traces) and a higher density of SD gNa (175 pS/μm2, bottom traces). Calibration: C, Left, Middle, 20 mV vertical, 200 ms horizontal; Right, 20 mV vertical, 2 ms horizontal (top), 200 mV·ms−2 vertical (bottom). Horizontal gray dotted lines indicate −60 mV (voltage traces).

