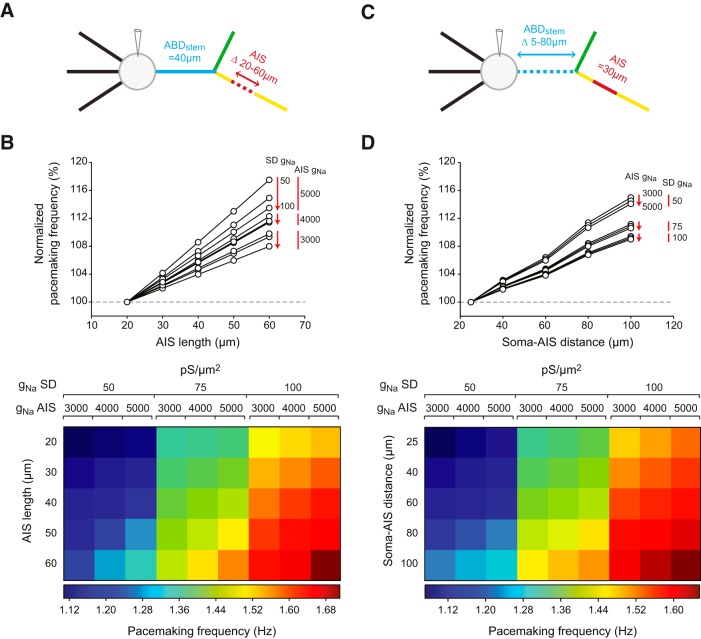
Figure 9.
Multicompartment modeling of AIS and ABD morphological variations. A, Schematic representation of the variations in AIS length simulated in the model. B, Top, Line and scatter plot representing the effect of changing AIS length on pacemaking frequency. The data from 9 simulations (combinations of 50–100 pS/μm2 SD gNa and 3000–5000 pS/μm2 AIS gNa) are represented. Bottom, Heatmap representation of the effect of changing AIS length (vertical axis) and SD gNa and AIS gNa (horizontal axis) on pacemaking frequency (color coding). C, Schematic representation of the variations in soma-AIS distance simulated in the model. D, Top, Line and scatter plot representing the effect of changing soma-AIS distance on pacemaking frequency for the 9 combinations already presented in A–C. Bottom, Heatmap representation of the effect of changing soma-AIS distance (vertical axis) and SD gNa and AIS gNa (horizontal axis) on pacemaking frequency (color coding).

